

If you’ve spent any time exploring technical analysis, you’ve almost certainly come across the Relative Strength Index. It’s one of those tools that appears on virtually every trader’s chart, and for good reason. In the fast-moving, often unpredictable world of crypto markets, having a clear, data-driven signal for when momentum is building or fading can mean the difference between a well-timed entry and an expensive mistake.
But here’s what most introductory guides won’t tell you: RSI is frequently misused. Traders treat it as a simple buy-or-sell switch, then wonder why the signals keep failing. This guide breaks down how an RSI strategy for crypto actually works: the mechanics, the nuances, the common pitfalls, and how to layer it into a robust trading approach that holds up under real market pressure.
The Relative Strength Index (RSI) is a momentum oscillator that measures the speed and magnitude of recent price changes, producing a value between 0 and 100. Introduced in 1978 by J. Welles Wilder Jr., it has evolved into one of the most indispensable and versatile indicators for traders across asset classes, including stocks, cryptocurrencies, forex, and commodities.
In crypto specifically, RSI earns its place because of what it captures: momentum. Research indicates that RSI momentum works on crypto in ways it doesn’t always replicate on traditional equities, partly because crypto markets are driven by retail sentiment cycles that create sharper and more repetitive overbought/oversold conditions.
Understanding how the number is actually produced helps avoid misreading it. The calculation runs in three steps over a chosen period (14 candles by default):
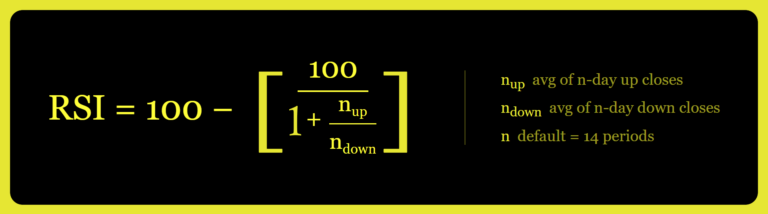
When recent gains are large relative to recent losses, n_up/n_down is high, pushing RSI toward 100. When losses dominate, the ratio collapses and RSI approaches 0. The practical result maps onto a 0–100 scale with three meaningful zones:
These thresholds are a starting point, not a rulebook. The real skill lies in knowing when they apply and when they don’t.
The right RSI settings depend entirely on your timeframe and trading approach. The default setting of 14 periods balances sensitivity with reliability, and works well for most traders. However, short-term traders may prefer RSI 7 for faster signals, while long-term investors might opt for RSI 21 to reduce false triggers.
Here’s a practical breakdown:
| Trading style | Recommended period | Timeframe | Notes |
|---|---|---|---|
|
Scalping
|
RSI 7–9
|
1m – 15m
|
More signals, more noise; use with tight stops
|
|
Day Trading
|
RSI 14
|
15m – 1H
|
Standard balance of speed and accuracy
|
|
Swing Trading
|
RSI 14–21
|
4H – Daily
|
Filters out short-term noise effectively
|
|
Position Trading
|
RSI 21–25
|
Daily – Weekly
|
Fewer signals, higher conviction setups
|
During periods of high volatility, shortening the RSI period (e.g., 7–10) can allow it to react faster to rapid price movements, making it more responsive. Conversely, longer periods smooth out fluctuations and suit trend-following strategies better.
One advanced technique worth adopting: multi-timeframe RSI. Using a shorter period RSI on a lower timeframe for precise entry points, combined with a longer period RSI on a higher timeframe for trend confirmation, can meaningfully enhance trading decisions.
1. Overbought/Oversold Mean Reversion
This is the most widely taught RSI application, and also the most frequently misunderstood. The premise: when RSI drops below 30, the asset may be oversold and due for a bounce; when it rises above 70, a pullback may be imminent.
The trap most traders fall into is treating these levels as automatic triggers. In bull markets, RSI can stay above 70 for extended periods while price continues higher. Selling every time RSI hits 70 is one of the most common and costly mistakes in technical analysis. The first touch of an extreme level is often the weakest signal; what matters more is how RSI behaves at that level — whether it reverses sharply, grinds sideways, or punches straight through.
Some traders tighten the thresholds to 80/20 rather than 70/30 to filter out weaker signals and focus only on more extreme momentum readings. This produces fewer trades but higher-conviction setups, which suits swing traders and prop evaluation environments better than high-frequency scalping.
A more reliable approach adds confluence conditions before acting on any overbought/oversold reading:
2. RSI Divergence: Reading Between the Lines
RSI divergence is arguably the most powerful, and most underused, application of the indicator. Divergences occur when price and RSI move in opposite directions, suggesting that the trend may be weakening and that the momentum behind a move is not as strong as it appears.
There are two types traders rely on:
Bullish divergence: A potential reversal signal to the upside:
Bearish divergence: A potential reversal signal to the downside:
Hidden bullish divergence: A trend continuation signal in an uptrend:
Hidden bearish divergence: A trend continuation signal in a downtrend:
The key distinction worth internalizing: regular divergence signals potential reversals, while hidden divergence signals trend continuation. Both are useful, but they answer different questions — and confusing the two is a common source of mistimed entries.
One critical caveat: RSI is a lagging indicator, so in parabolic markets, multiple divergences can form while price continues aggressively in its current direction. Confirmation from a secondary signal (like a trendline break or a volume spike) before executing a trade based on divergence is essential.
3. RSI 50 Line: The Trend Filter Most Traders Ignore
Less glamorous than divergence, but highly practical: using the 50 midline as a trend filter. A buy signal occurs when RSI breaks above 50 and price is in an uptrend; a sell signal occurs when RSI breaks below 50 and price is in a downtrend.
This approach sidesteps the overbought/oversold extremes entirely and instead focuses on directional momentum. When RSI holds above 50, bulls control the pace of price change. When it falls and stays below 50, bears are in charge. The 50 line essentially asks a simpler question than the 70/30 extremes: not “is this asset stretched?” but “which side has momentum right now?”
In practice, the cleanest signal comes from a sustained cross of the 50 level, not a brief spike above or below it. A single candle piercing 50 and retreating is noise; RSI closing above 50 for two or three consecutive periods, with price structure confirming the direction, is a meaningful shift.
This is also the approach with the strongest academic support in crypto-specific research. A peer-reviewed study published in PMC found that standard overbought/oversold strategies and divergence signals both produced ineffective results in isolation, while using RSI above/below 50 as a trend filter was the only approach to generate unambiguously positive outcomes in backtesting — and the only one that held up after adding stop-losses. It’s a finding that most RSI guides quietly ignore.
For traders who want a repeatable, structured framework, particularly useful for prop trading evaluations where consistency matters, this four-step process captures high-probability swing entries:
This approach is designed to capture bullish RSI swing signals with better timing than simply buying the first oversold reading, which can often lead to catching a falling knife. It’s also the kind of defined, repeatable process that separates traders who pass funded account evaluations from those who don’t: every step has a condition, and every condition has a reason.
RSI is best understood as a filter, not a trigger. Alone, it’s a number on a screen. Combined with market structure, price action, and risk management, it becomes one of the sharpest tools on the chart.
Common high-value combinations include:
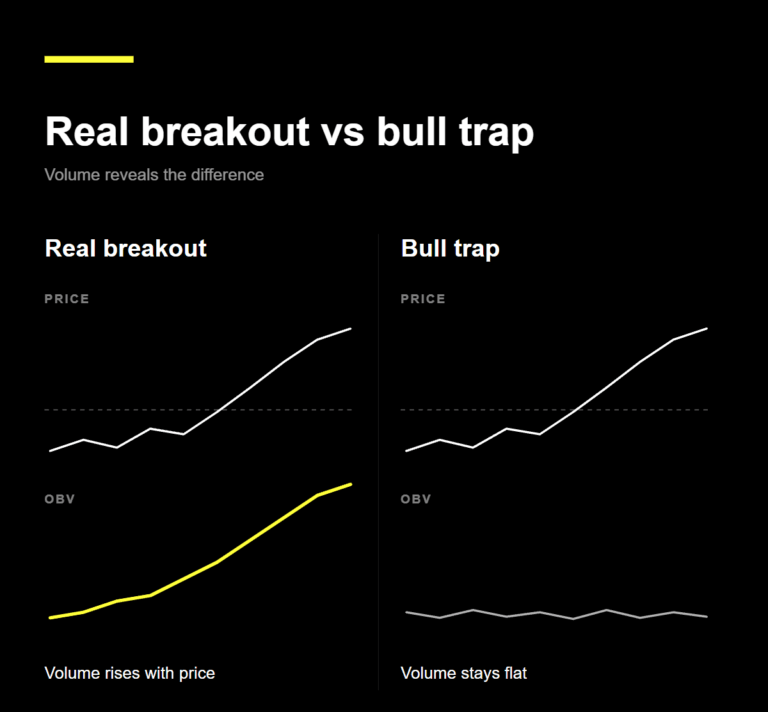
RSI + Volume: Volume is an excellent secondary filter. A divergence signal accompanied by a meaningful volume shift carries significantly more weight than one that forms on thin, unconvincing volume.
No tool is complete without understanding where it breaks down. RSI has well-documented failure modes in crypto:
A useful corrective: treat every RSI signal as a hypothesis that needs confirmation from at least one other source — price structure, volume, or a complementary indicator — before it becomes a trade.
For traders working toward a prop firm evaluation, or already trading funded capital, RSI strategy becomes more than just a tool for finding entries. It becomes part of a discipline framework — and that shift in framing matters more than most traders realize until they’re inside an evaluation.
Prop trading environments reward consistency and controlled drawdown above all else. The traders quietly moving from personal capital into funded environments tend to share one trait: they trade systems, not feelings. RSI fits naturally into that mindset because it gives structure to decisions that would otherwise be discretionary — and in a prop evaluation, discretionary decisions have a way of compounding into drawdown.
Concretely, RSI helps prop traders:
Platforms like Crypto Fund Trader have built their evaluation structure around exactly these principles. Rather than rewarding traders who swing for maximum returns, the model favors those who demonstrate consistency and controlled risk over a defined period — which is precisely where a rules-based RSI approach earns its keep. For traders who have already done the work of building a structured system, a funded crypto account represents a meaningful step up in scale without proportionally increasing personal financial exposure.
Professional traders typically risk only 0.5%–1% of account capital on any single idea. The goal is not to maximize one trade but to survive the bad streaks that every strategy inevitably produces. RSI, used as part of a multi-confluence framework, reduces the frequency of low-probability setups that quietly erode capital — and evaluation scores — over time.
Before placing any RSI-based trade, run through this checklist:
Whatever strategy you choose, always test it on historical data and demo trades first. RSI is powerful, but context matters: it should be paired with strong price structure, volume, and the overall market trend for the best results.
The RSI is not a magic formula, and no serious trader should treat it as one. What it offers is something more practical: a consistent, readable measure of momentum that — when read in context — helps traders stay aligned with the market’s actual conditions rather than their assumptions about it.
For crypto traders specifically, mastering RSI strategy means learning to read it as a conversation between price and momentum. When they agree, the trend is healthy. When they diverge, something is quietly shifting beneath the surface.
Whether you’re building toward a prop trading challenge, refining a swing trading system, or simply trying to add more structure to your analysis, RSI belongs in your toolkit. The traders accessing funded capital today aren’t necessarily the most talented — they’re the most prepared. The key is using RSI as one voice in a larger conversation, not the only one.
Why does everyone say RSI is the best indicator when it keeps giving false signals?
RSI gives false signals when you use it alone, which is how most beginners use it. It’s a momentum filter, not a buy/sell trigger. A reading at 70 or 30 only means something when it coincides with a real price level — support, resistance, a moving average, or a volume shift. Without that context, you’re just reacting to a number. The traders who find RSI useful aren’t using it differently; they’re using it with something else.
RSI 7 or RSI 14 — which one actually works for crypto?
RSI 14 is the default for a reason: it balances responsiveness and accuracy well enough to work across most timeframes. RSI 7 reacts faster, which sounds good but means more signals, more noise, and more false triggers — especially on short timeframes where crypto is already chaotic. For scalping on 1–5 minute charts, faster settings make sense. For anything on a 1H chart or above, RSI 14 is the cleaner choice. The setting matters less than whether you’re using it on the right timeframe for your strategy.
Why not just use MACD instead of RSI? What’s the actual difference?
RSI and MACD measure different things, and that’s exactly why they’re often used together. RSI measures the speed and magnitude of recent price changes — pure momentum. MACD measures the relationship between two moving averages — trend direction and crossovers. RSI tells you how stretched a move is; MACD tells you which way the trend is leaning. Using one as a momentum read and the other as a trend filter is a cleaner setup than trying to use either alone.
Does RSI actually work on low-cap alts or is it useless there?
RSI is less reliable on low-cap, low-liquidity tokens. Those markets are thin enough that a single large buyer or seller can spike the price and distort the indicator without any genuine momentum shift behind it. Pump-and-dump patterns, wash trading, and manipulated volume all feed into RSI calculations in ways that make the signals noisy and unreliable. Stick to liquid assets where RSI is reading real market participation, not someone moving their own bag.
What’s the RSI 50 line and why do people mention it more than 70/30?
The 50 line is a trend filter, not an extreme signal — and for many setups it’s actually more reliable than the 70/30 levels. When RSI holds above 50, buyers have controlled momentum for that period; below 50, sellers are in charge. It answers a simpler question than the extremes: not “is this stretched?” but “who has momentum right now?” A peer-reviewed backtest on crypto specifically found the 50-line approach was the only RSI method that produced consistently positive results after stop-losses were added — the overbought/oversold and divergence strategies both failed in isolation. Most guides skip over this finding entirely.
This article is for educational purposes only and does not constitute financial advice. Crypto trading involves significant risk, including the potential loss of capital. Always conduct your own research and consider your risk tolerance before trading.
-
© 2026 - All Rights Reserved.
SWISS RLCRATES AG is a provider of educational services, all information available on our site is intended solely for the study purposes related to trading on financial markets. Accordingly, we do not offer financial, investment, tax, brokerage or other advice and/or services. Trading in financial markets is a high-risk activity, past performance do not guarantee future ones. It is highly advised not to risk more, than you can afford to lose. Brokers and operators of trading platforms are persons or entities that are separate from SWISS RLCRATES AG and their own terms and conditions will apply when you use their services and products. Neither SWISS RLCRATES AG nor RLCRATES, S.L. (as MT5 license holder) operate in countries where crypto or CFD’s activity is not allowed. The content in our platform is applicable to the extent local laws and/or regulations permit.