

Open the chart of almost any struggling trader and you will find the same thing: a price chart buried under six indicators, three of them contradicting each other. RSI says oversold, MACD says sell, a moving average cloud says wait, and the trader freezes. Meanwhile the chart itself, the actual record of where buyers and sellers fought, sits ignored underneath the clutter.
Price action crypto trading strips that away. Instead of reacting to indicators that are themselves just math performed on price, you read price directly: where it has turned before, how candles behave at those levels, and which side is winning the fight right now. Indicators lag because they are built from past prices. Price action is the present tense. This guide shows how to read a crypto chart using nothing but structure, levels, and candles, with concrete examples of where to enter and exit.
Price action is the study of how price moves, on its own, without indicators layered on top. Every candle on a chart is a record of a battle between buyers and sellers over a fixed period. Read enough of them in context and you can see who is in control, where they took a stand, and where they gave up.
The logic behind crypto price action is simple. An indicator like RSI takes price data, runs a formula, and hands you a number that is, by definition, a step behind the price that created it. Price action removes that step. You are reading the source material rather than a summary of it. This does not make price action magic or always correct. It makes it immediate, and in a market that moves as fast as crypto, immediacy is worth a great deal.
Price action also travels well. The same principles read a 5-minute Bitcoin chart and a weekly Ethereum chart, because human behavior at key levels (fear, greed, hesitation) repeats across every timeframe. Once you can read structure, you can read any chart on any asset.
Before any candle pattern or level, you read structure. Market structure is the sequence of highs and lows that tells you the trend, and it is the single most important skill in price action.
The pivotal moment is the break of structure. When an uptrend that has been making higher lows suddenly prints a lower low, the structure has shifted, and that is your earliest warning that control may be changing hands. A trader who reads structure sees the trend weaken before any indicator confirms it, because the indicator is waiting for the same price data to pile up.
Structure tells you the trend. Support and resistance tell you where the trend is likely to pause, reverse, or accelerate.
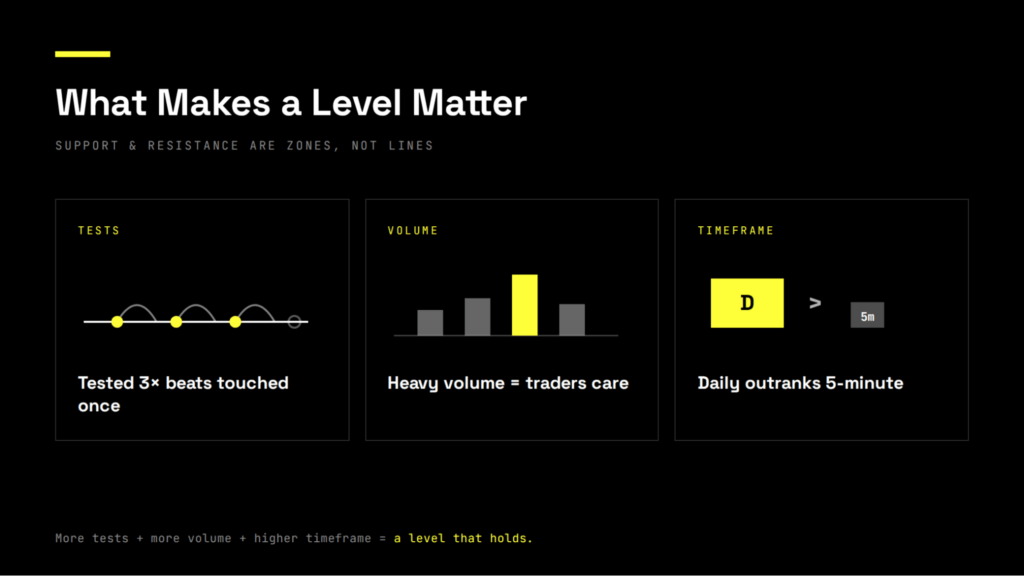
Support is a price level where buying has repeatedly overwhelmed selling, creating a floor. Resistance is the opposite, a ceiling where sellers keep stepping in. These are not exact lines but zones, because thousands of traders eyeball slightly different prices.
Three things make a level matter more. The number of times price has reacted to it, since a level tested three times is more significant than one touched once. The volume on those reactions, since heavy participation marks a level traders genuinely care about. And the timeframe it appears on, since a level visible on the daily chart outranks one only on the 5-minute.
The most useful behavior to learn is the role flip. When price breaks above a resistance level and then comes back to it, that old resistance often becomes new support. The level where sellers once dominated now attracts buyers, because the people who sold there are now wrong and the people who bought the breakout defend it. This flip is one of the cleanest setups in price action crypto trading, and the examples below lean on it.
You do not need to memorize forty candlestick patterns. A handful, read in context at the right level, do almost all the work. The context is what matters: the same candle means different things at support than in the middle of nowhere.
The rule that ties these together: a candle signal only counts when it forms at a level that already matters. A pin bar in empty space is noise. A pin bar with a long lower wick rejecting a daily support that has held twice before is a signal worth acting on.
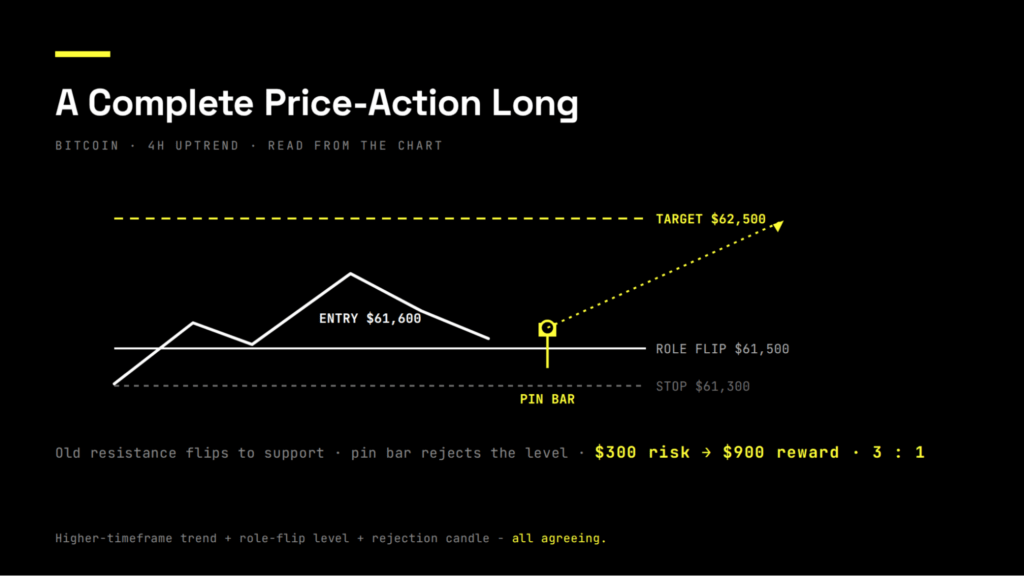
Theory becomes useful only in a concrete trade. Here is a complete price action long, no indicators involved.
On the 4-hour chart, Bitcoin has been in an uptrend, printing higher highs and higher lows. Price rallies, then pulls back toward $61,500, a level that acted as resistance a week ago and was broken to the upside. That old resistance is now a candidate for new support, the role flip in action.
You drop to the 1-hour chart and watch how price behaves at $61,500. Instead of slicing through, price prints a pin bar with a long lower wick: sellers pushed it down to $61,400, buyers rejected it and closed back at $61,600.
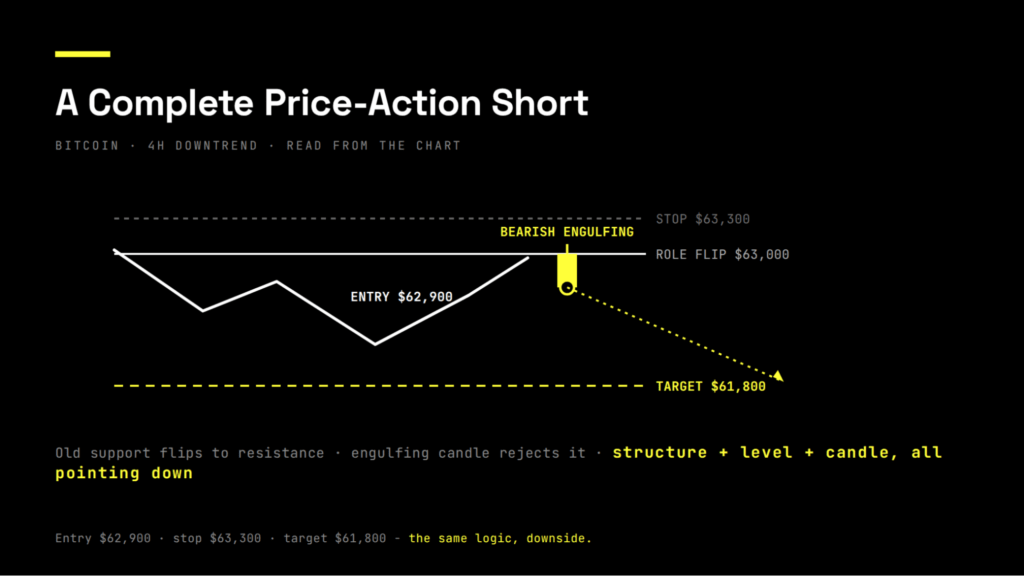
The same logic reads the downside. Bitcoin is in a 4-hour downtrend, lower highs and lower lows. Price rallies into $63,000, an old support level that broke and should now act as resistance. On the 1-hour chart, a bearish engulfing candle forms right at $63,000, a large red body swallowing the prior green one. Entry on the close near $62,900, stop above the rally high around $63,300, target at the recent low near $61,800. Structure, level, and candle agree again, this time pointing down.
It is just as important to know when not to trade. Suppose that same pin bar at $61,500 had formed while the higher timeframe was in a clear downtrend, with price making lower lows. Now the candle signal fights the structure. That is a low-probability trade, the kind that produces a quick stop-out. Price action is not about taking every pretty candle. It is about taking the ones where the context stacks in your favor and passing on the rest.
Crypto moves fast, gaps on news, and runs 24 hours a day. Indicators that lag in slow markets lag worse in fast ones, often flashing a signal after the move has already happened. Price action sidesteps that delay because it reads the move as it forms.
There is also a psychological benefit. A chart with one or two clean levels and a candle signal gives you a clear yes or no. A chart with eight indicators gives you permission to find a reason for any decision you already wanted to make, which is how traders rationalize bad entries. Simplicity is not just cleaner. It is harder to fool yourself with.
This does not mean indicators are useless. Many strong traders use a single one, often volume or a key moving average, as a secondary check on top of price action. The mistake is leading with indicators and ignoring the chart, rather than reading the chart first and using a tool to confirm.
Reading charts well is only half the job. A flawless price action read on an oversized position with no stop still ends in a blown account, because one bad trade erases many good ones.
The same rules apply here as in any sound approach. Risk a small fixed fraction of the account per trade, often 1 percent, so no single loss matters much. Size the position from the stop distance rather than from the leverage available: divide your dollar risk by the distance to your stop to get the position size. Set every entry, stop, and target before you click, never after. And keep the stop where you placed it, because moving it to avoid a loss is the most expensive habit in trading.
Price action makes stops more logical, which is a quiet advantage. Your stop goes below the level that, if broken, proves your read wrong, not at an arbitrary percentage. That gives the trade a real reason to be closed, and it keeps your losses defined.
Many traders reach a point where the skill is there but the capital is not. Reading structure and levels accurately on a $1,000 account still only risks pocket change per trade. This is the gap crypto proprietary trading firms aim to close.
A prop firm gives access to its capital after an evaluation, then enforces strict limits, usually a daily loss cap near 5 percent and a maximum drawdown near 10 percent. A price action trader who already sizes by risk and places logical stops tends to fit that framework naturally, because the firm’s rules demand the same discipline a clean chart-reading process already builds. The firm shares the profit, and the downside of failing is the evaluation fee rather than personal savings.
Crypto Fund Trader is one example in the crypto-native space. It has operated since November 2022 under a Swiss-registered company, offers funded accounts with leverage up to 1:100, and routes part of its evaluation through a Bybit integration so orders execute on real exchange infrastructure. For a disciplined chart reader, the appeal is structure: the firm’s limits reinforce the habits that are hard to maintain on a personal account.
Skill here comes from reps, not theory. A practical way to build it costs nothing.
Open a chart and mark the structure first: higher highs and lows, or lower highs and lows, or a range. Then draw the two or three levels that obviously matter, the ones price has reacted to more than once. Resist adding more than that. Now scroll the chart forward candle by candle, if your platform allows replay, and predict what price does at each level before revealing it. You will be wrong often at first, which is the point.
Keep a journal of the setups you would have taken: the structure, the level, the candle, and what happened. Over a few weeks you will start to see which combinations actually work for you and which pretty candles were traps. That feedback loop teaches chart reading faster than any course, because it trains your eye on the only thing that matters, real price behavior at real levels.
Reading charts without indicators is not a gimmick or a purist’s badge. It is a return to the source: price itself, and the human behavior written into every candle. Master three things, market structure, the levels where decisions happen, and the candle signals that confirm them, and you can read any crypto chart on any timeframe without a single lagging tool.
The edge in crypto price action is not that it predicts the future. Nothing does. The edge is that it keeps you reading the present clearly, sizing trades by logical risk, and acting only when structure, level, and candle agree. In a market that punishes hesitation and overcomplication alike, clarity is the rarest advantage there is.
Is price action crypto trading better than using indicators?
Neither is strictly better, but price action reads the market in real time while indicators lag because they are calculated from past prices. Many strong traders lead with the chart and use at most one indicator, like volume, as a secondary check.
Can I really trade crypto with no indicators at all?
Yes, plenty of traders use only market structure, support and resistance, and candlestick signals, since those read the actual buyer and seller behavior directly. The key is taking trades only where structure, a meaningful level, and a candle signal all agree.
What is the most important price action skill to learn first?
Market structure, the sequence of higher highs and lows or lower highs and lows, because it tells you the trend before any level or candle matters. A break of that structure is often your earliest warning that control is shifting.
Does price action work on low timeframes like the 5-minute chart?
It does, because crypto price action reflects the same human behavior at key levels on every timeframe, though lower charts carry more noise and false signals. Beginners usually get cleaner reads starting on the 1-hour or 4-hour chart.
How do I avoid false signals in price action trading?
Trade candle signals only when they form at a level that already matters and agrees with the higher-timeframe structure, and skip the ones fighting the trend. A pin bar in empty space is noise, while the same candle at tested support with the trend behind it is a real setup.
How long does it take to get good at reading charts?
Most traders need months of deliberate practice and journaling, not days, because the skill is pattern recognition built from many repetitions. Reviewing your marked setups and outcomes regularly speeds that process far more than consuming more theory.
This article is for informational and educational purposes only and does not constitute financial advice. Trading cryptocurrencies and prop firm challenges involve significant risk; trade only with capital you can afford to lose.
-
© 2026 - All Rights Reserved.
SWISS RLCRATES AG is a provider of educational services, all information available on our site is intended solely for the study purposes related to trading on financial markets. Accordingly, we do not offer financial, investment, tax, brokerage or other advice and/or services. Trading in financial markets is a high-risk activity, past performance do not guarantee future ones. It is highly advised not to risk more, than you can afford to lose. Brokers and operators of trading platforms are persons or entities that are separate from SWISS RLCRATES AG and their own terms and conditions will apply when you use their services and products. Neither SWISS RLCRATES AG nor RLCRATES, S.L. (as MT5 license holder) operate in countries where crypto or CFD’s activity is not allowed. The content in our platform is applicable to the extent local laws and/or regulations permit.