

The crypto market that traders face in 2026 is a different animal than the one that minted overnight millionaires in 2021. Liquidity now fragments across centralized exchanges, decentralized venues, and perpetual futures markets in real time. Algorithmic mean reversion, retail-driven momentum, and institutional flow all collide in the same order books, often within minutes. Daily liquidations on Bitcoin perpetuals routinely run into nine figures, and entire altcoin charts can rewrite themselves on a single funding cycle. In that environment, gut feel isn’t a strategy. It’s a liability.
That’s where indicators come in. The best indicators for crypto trading don’t predict the future — nothing does — but they give traders a structured, repeatable way to read what the market is actually doing. For anyone working through a prop firm evaluation or managing a funded account, that repeatability is the difference between scaling a six-figure position and blowing past a daily drawdown limit at 3 a.m.
This guide breaks down the ten indicators professional crypto traders rely on heading into 2026, why each still works, and how to combine them without falling into the analysis-paralysis trap that quietly kills most beginner accounts.
Crypto trading indicators are mathematical tools that analyze price, volume, or open interest data to highlight trends, momentum shifts, and potential reversals. They turn a chaotic candlestick chart into something closer to a dashboard — a way to read market behavior without relying on hunches.
Indicators generally fall into five categories:
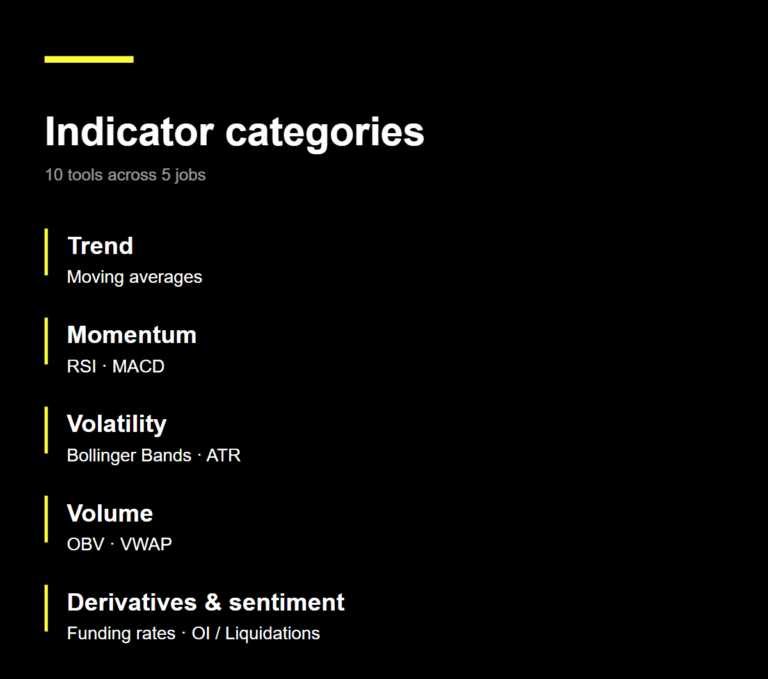
Most professionals don’t favor one category exclusively. They stack two or three tools across different categories — a trend filter, a momentum confirmation, and a volume or positioning check — to build a clearer picture.
For prop traders, indicators create auditable, rules-based decisions that survive risk-management scrutiny. Top crypto prop firms favor clean, repeatable signals — moving average crossovers, RSI thresholds, Bollinger Bands — because they produce objective entries and exits that can be logged.
That preference reflects an industry-wide shift. The crypto prop trading industry crossed $20 billion in 2025, with over 60 active firms competing for evaluation fees in 2026. Operators that survived the 2024–2025 shakeout — when 80 to 100 firms collapsed and took unpaid trader earnings with them — now expect a documented thesis on every trade. Indicators provide that documentation.
A trader who can say “I went long because price held the 50-EMA, RSI bounced off 40, and OBV confirmed accumulation” has a defensible setup. A trader who shrugs and says “it felt right” has a problem. The space has consolidated around a smaller group of credible operators — which raises the bar for entry but also means the firms still standing tend to pay reliably, and traders who get funded now are the ones who refined their indicator stack before the next major volatility window opened.
1. Relative Strength Index (RSI)
The Relative Strength Index measures the speed and magnitude of price changes on a 0–100 scale, flagging when an asset may be overbought or oversold. Developed by J. Welles Wilder Jr. in 1978, RSI remains one of the most widely used momentum oscillators in crypto.
The classic reading: above 70 suggests overbought, below 30 oversold. But in trending crypto markets, RSI can stay extreme for weeks — that’s a momentum signal, not a reversal signal. Many 2026 traders shorten the traditional 14-period RSI to 9 or 11 periods to handle crypto’s volatility, and use divergence — price making a new high while RSI doesn’t — as a more reliable warning of exhaustion.
2. Moving Averages (SMA and EMA)
Moving averages smooth historical price data into a single line that defines the underlying trend. The Simple Moving Average weights every period equally; the Exponential Moving Average weights recent prices more heavily, making it quicker to react.
Exponential moving averages are typically preferred on lower timeframes, while simple moving averages dominate higher timeframe analysis. The classic “golden cross” — when the 50-day crosses above the 200-day — and its opposite “death cross” remain widely watched signals for major cycle shifts.
3. MACD (Moving Average Convergence Divergence)
MACD is a trend-following momentum indicator that plots the difference between two EMAs (typically 12 and 26 period) with a 9-period signal line layered on top. Created by Gerald Appel in the late 1970s, it remains one of the most reliable tools for catching new trends in crypto.
The histogram visualizes the gap between the two lines: a positive, expanding histogram signals strengthening bullish momentum. MACD is most powerful when paired with structural levels — a bullish crossover at long-term support is a far stronger signal than the same crossover in a chop zone.
4. Bollinger Bands
Bollinger Bands wrap a moving average in two outer bands set at two standard deviations above and below it, creating a dynamic envelope of “normal” price action. John Bollinger introduced the indicator in the 1980s, using a middle SMA, an upper resistance band, and a lower support band calculated from standard deviations.
When the bands compress tightly, a major breakout is usually approaching. When price tags the upper band repeatedly during a strong uptrend, that’s continuation, not exhaustion. The mistake beginners make is treating every band touch as an automatic reversal — experienced traders combine band reads with volume and structure before acting.
5. Volume-Weighted Average Price (VWAP)
VWAP is the average price of an asset weighted by volume, and it has become a staple among institutional crypto traders. Because institutions often benchmark execution quality against VWAP, the levels become self-reinforcing — professionals use it to assess intraday bias, time entries during pullbacks, and avoid chasing extended moves.
Anchored VWAP — tied to a major high, low, or volatility event rather than the session open — has become particularly valuable in markets where narratives shift quickly. It marks “fair value since this event,” useful for timing entries instead of chasing pumps already in motion.
6. Funding Rates (Perpetual Futures)
Funding rates are periodic payments exchanged between long and short traders on perpetual futures contracts, designed to keep the perp price tethered to spot. There’s no equivalent in traditional markets, which makes funding the most crypto-native indicator on this list — and one of the most useful in 2026.
Positive funding means longs are paying shorts (a crowded long market); negative funding means shorts are paying longs (a crowded short market). Sustained extremes are one of the cleanest contrarian signals available: when Bitcoin funding stays heavily positive across major exchanges for days, the leveraged long crowd is overcrowded, and a long squeeze becomes increasingly likely. Aggregators like Coinglass and Hyblock pull funding data across Binance, Bybit, OKX, and others into a single view. The classic failure mode is acting on funding alone — in strong trends, funding can stay elevated far longer than feels reasonable, which is why it’s best paired with structure or momentum confirmation.
7. On-Balance Volume (OBV)
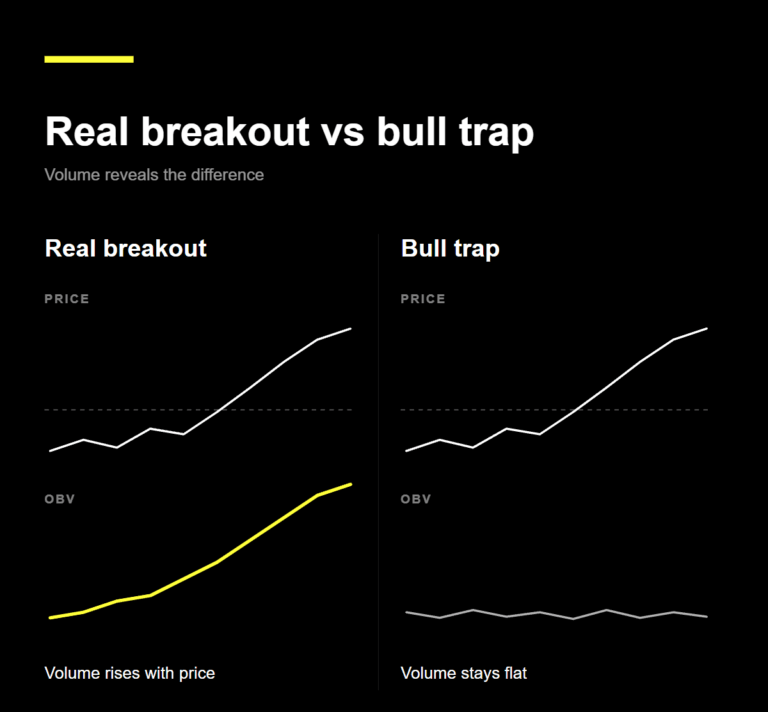
On-Balance Volume is a cumulative volume indicator that adds volume on up-days and subtracts it on down-days, creating a running tally of buying versus selling pressure. Joseph Granville introduced it in 1963, and it remains one of the cleanest ways to confirm whether a price move has real conviction behind it.
A breakout with rising OBV is high-probability. A breakout where OBV stays flat or declines is usually a trap. With institutional adoption growing, volume analysis has become more reliable in crypto markets — Volume Profile and OBV are now essential for understanding market structure and identifying high-probability setups. The caveat: OBV is exchange-specific. Reading OBV on a thin altcoin pair on a single venue can mislead, since the real volume picture lives across multiple exchanges and the perp market.
8. Open Interest and Liquidation Heatmaps
Open interest tracks the total value of outstanding derivatives contracts, while liquidation heatmaps show where leveraged positions will be forcibly closed if price reaches certain levels. Together, they reveal where the market’s leverage is concentrated — and where price tends to be magnetized.
Rising open interest into a price move signals fresh capital and conviction. Rising open interest while price stalls signals overcrowded positioning vulnerable to a flush. Liquidation heatmaps from Coinglass and Hyblock have become essential reading in 2026, because price often gravitates toward heavy liquidation clusters before reversing — a phenomenon professional desks call “liquidity hunting.” The trap is treating heatmaps as a crystal ball: liquidations are where price might go, not where it has to go.
9. Average True Range (ATR)
ATR measures average volatility by calculating the true range between high, low, and previous close over a set period. It doesn’t give buy or sell signals — it tells you how much an asset typically moves, which is essential for position sizing and stop-loss placement.
In choppy markets, traders adjust their stop losses based on how wild prices act, setting stops farther away to avoid getting shaken out by sudden spikes — bigger ranges protect positions when things get messy. Most prop firm risk frameworks expect traders to size positions based on ATR rather than fixed dollar amounts.
10. Market Structure (Support and Resistance)
Market structure — the pattern of higher highs and higher lows in an uptrend, or lower highs and lower lows in a downtrend — is arguably the most important “indicator” of all, even though it’s drawn manually rather than calculated. Many professionals would argue that market structure itself is the most important indicator: higher highs and higher lows define trends, while support and resistance highlight where psychology shifts.
In 2026, successful traders prioritize swing highs and lows, range boundaries, and liquidity pools around obvious levels. Indicators are most powerful when they confirm what structure is already telling you — not when they argue against it.
| Indicator | Category | Best Used For | Leading or Lagging |
|---|---|---|---|
|
Bollinger Bands
|
Volatility
|
Breakout setups, squeeze detection
|
Mixed
|
|
VWAP
|
Volume / Price
|
Intraday execution, fair value benchmark
|
Mixed
|
|
Funding Rates
|
Sentiment / Positioning
|
Contrarian signals, crowded trades
|
Leading
|
|
OBV
|
Volume
|
Confirming move conviction
|
Leading
|
|
Open Interest / Liquidations
|
Leverage concentration, magnet zones
|
Leverage concentration, magnet zones
|
Leading |
|
ATR |
Volatility |
Stop placement, position sizing
|
Lagging |
|
Market Structure
|
Price Action
|
Bias, key liquidity levels
|
Real-time
|
Not every indicator earns its place on every chart. The matrix below shows where each tool tends to deliver the most signal versus the most noise.
| Indicator | Scalping (1m–15m) | Day Trading (15m–4h) | Swing (4h–1d) | Position (1d–1w) |
|---|---|---|---|---|
|
RSI
|
High
|
High
|
High
|
Medium
|
|
Moving Averages
|
Low
|
Medium
|
High
|
High
|
|
MACD
|
Medium
|
High
|
High
|
Medium
|
|
Bollinger Bands
|
High |
High |
Medium |
Low |
|
VWAP |
HIgh |
HIgh |
Medium |
Low |
|
Funding Rates
|
Medium |
High |
High |
High |
|
OBV |
Low |
Medium |
High |
High |
|
OI / Liquidations
|
High |
High |
Medium |
Low |
|
ATR |
High |
High |
High |
High |
|
Medium |
High |
High |
High |
High |
The most common mistake new traders make is stacking eight indicators on a single chart and calling it analysis. With ten indicators on your chart, one will always say buy and one will always say sell — that’s analysis paralysis. The result is contradiction, hesitation, and missed setups.
The cleaner approach uses one indicator from each major category, layered intentionally:
A complete BTC/USD trade plan might run as a four-step checklist:
That’s the kind of documented setup most prop firms expect attached to a trade log — typically a one-page plan with entry, stop, target, and the indicator combo used.
It’s also the kind of structured approach that crypto-native prop firms have been built around. Crypto Fund Trader, for example, sits in the small group of operators that survived the 2024–2025 shakeout and continued growing through 2026, with evaluation rules designed for traders who can demonstrate a repeatable edge rather than chase home-run trades. For someone who has spent months sharpening an indicator stack but still trades a small personal account, that gap — between having a working strategy and having capital to deploy it on — is usually what holds the next stage of progress hostage. The traders getting funded right now are the ones who closed it before the next leg of the cycle started moving without them.
The most expensive errors tend to repeat across every account size:
| Mistake | Why It Hurts | The Fix |
|---|---|---|
|
Treating indicators as predictions
|
9-day range, $3,200–$3,400, contracting candles
|
Use as filters, require confluence
|
|
Ignoring market structure
|
Trades fight the chart's bias
|
Confirm key levels before entry
|
|
Over-optimizing settings
|
Curve-fits to past regimes
|
Test across multiple coins and cycles
|
|
Forgetting black swans
|
Indicators only read history
|
ATR-based stops, hard risk caps
|
|
No volume context
|
Low-volume moves often reverse
|
Always check OBV or VWAP
|
The honest truth — the kind professional traders learn the hard way — is that indicators don’t make money. Disciplined risk management, consistent execution, and a documented edge make money. Indicators are how you implement that edge.
For traders entering a crypto prop firm evaluation in 2026, that distinction is everything. A funded account isn’t a lottery ticket; it’s a job interview that happens in real time, judged against drawdown limits and consistency rules. Traders who pass tend to use fewer indicators, not more — typically two or three core tools combined with strict position sizing and a clear plan for every trade.
Mastering RSI, moving averages, MACD, Bollinger Bands, VWAP, and a structural read of the chart will cover most high-probability setups. Layer in ATR for risk control, OBV for confirmation, and crypto-native data like funding rates and liquidation heatmaps for sentiment context, and the toolkit is complete.
The crypto market in 2026 rewards patience over prediction and process over hot takes. The indicators above won’t make anyone profitable on their own. But used with discipline — and paired with a venue that lets a trader scale beyond personal capital — they keep traders in the game long enough to become one. In a cycle where volatility windows open and close on their own schedule, surviving long enough to catch one is most of the work.
What is the most accurate indicator for crypto trading?
No single indicator is consistently the most accurate, because each measures a different dimension of market behavior. Volume-based tools like OBV and VWAP, and derivatives data like funding rates and open interest, tend to give the cleanest signals in 2026 because they measure real participation rather than just price.
Can you trade crypto with just one indicator?
Technically yes, but rarely advisable. Even disciplined single-indicator strategies usually depend on a structural read of the chart in the background. Using one indicator in genuine isolation produces false signals, especially during regime shifts between trending and ranging conditions.
Which indicators are best for day trading crypto?
For intraday crypto trading, RSI, VWAP, Bollinger Bands, and liquidation heatmaps tend to deliver the highest signal-to-noise ratio. ATR is essential for sizing stops in volatile sessions. Slower tools like the 200-day SMA update too slowly to inform short-term entries.
Do technical indicators still work in crypto in 2026?
Yes, but as decision frameworks rather than prediction tools. Indicators that filter trades — defining bias, confirming participation, sizing risk — continue to work consistently. The shift in 2026 is that crypto-native data sources (funding, open interest, on-chain flows) now matter alongside traditional TA.
Are paid indicators worth it compared to free ones?
For most traders, no. The free toolkit on TradingView, plus derivatives data from Coinglass and on-chain context from Glassnode or CryptoQuant, covers what most profitable crypto traders actually use.
This article is for educational purposes only and does not constitute financial advice. Trading cryptocurrency involves significant risk, and past performance does not guarantee future results. Always conduct independent research and consider consulting a licensed financial advisor before making investment decisions.
-
© 2026 - All Rights Reserved.
SWISS RLCRATES AG is a provider of educational services, all information available on our site is intended solely for the study purposes related to trading on financial markets. Accordingly, we do not offer financial, investment, tax, brokerage or other advice and/or services. Trading in financial markets is a high-risk activity, past performance do not guarantee future ones. It is highly advised not to risk more, than you can afford to lose. Brokers and operators of trading platforms are persons or entities that are separate from SWISS RLCRATES AG and their own terms and conditions will apply when you use their services and products. Neither SWISS RLCRATES AG nor RLCRATES, S.L. (as MT5 license holder) operate in countries where crypto or CFD’s activity is not allowed. The content in our platform is applicable to the extent local laws and/or regulations permit.