


Few setups generate as much excitement — or as many losses — as the breakout. A coin coils for days inside a tight range, the chart finally cracks above resistance, and traders pile in expecting fireworks. Sometimes price rockets. Often, it snaps back through the level and stops out everyone who chased the move.
The traders who consistently capture those big moves aren’t watching different charts than everyone else. They’re watching the same charts with a different framework — one that knows what a real breakout looks like, what a fake one does, and how to size positions so the inevitable failures don’t derail the account.
A crypto breakout strategy enters a position the moment price decisively pushes through a defined level of support or resistance, aiming to ride the momentum that typically follows. The thesis is simple: when an asset has been compressed inside a range, the breach of that range often signals a meaningful shift in supply and demand.
The mechanics rest on three forces crypto markets express more violently than most:
Because crypto trades around the clock and is dominated by retail flow, these dynamics produce sharper, faster moves than equities or forex — which is exactly why breakout strategies remain a staple for prop traders working tight risk parameters.
Four breakout categories account for most tradable setups, each requiring a slightly different read on price action.
Direction matters too. A bullish breakout clears resistance to the upside; a bearish breakdown slices through support. Some of the cleanest prop trading setups come from breakouts that align with the higher-timeframe trend — a four-hour breakout in the same direction as the daily trend tends to follow through more reliably than a counter-trend break.
Liquidity profile changes everything about how a breakout behaves. Matching the strategy to the asset is half the work.
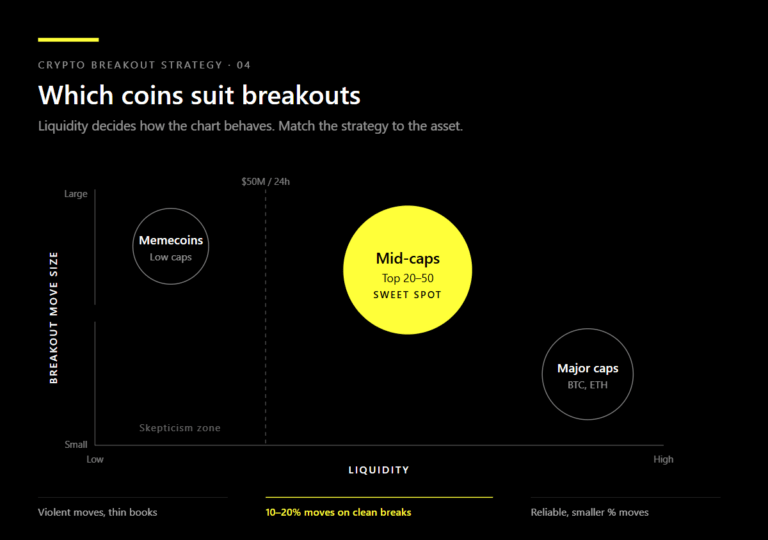
Rule of thumb: if 24-hour volume on a major exchange is below $50 million, treat every breakout signal with extra skepticism regardless of how clean the chart looks.
Most breakouts fail. Thomas Bulkowski’s Encyclopedia of Chart Patterns — the most extensive statistical study of breakout behavior in traditional markets, now in its third edition (Wiley, 2021) — documents failure rates of 60–80% across most pattern types. Crypto, with thinner order books, retail-heavy flow, and weekend liquidity gaps, almost certainly sits at the higher end.
If two out of three breaks fail, the goal isn’t to catch every move — it’s to filter for the minority that follow through. False breakouts cluster around predictable conditions: weekends, late-night UTC hours (12 AM to 6 AM), and major holidays. The European/US session overlap, roughly 12 PM to 8 PM UTC on Tuesday through Thursday, produces the most reliable signals.
The right entry style depends on risk tolerance, screen time, and tolerance for false starts.
| Entry Approach | How It Works | Risk Profile | Best For |
|---|---|---|---|
|
Aggressive breakout
|
Enter the moment price breaches the level on a volume spike
|
High — exposed to fakeouts; tightest stop placement
|
Experienced traders watching live charts
|
|
Confirmation close
|
Wait for a full candle to close beyond the level before entering
|
Moderate — filters most fakeouts but gives up some of the move
|
Most retail and prop traders
|
|
Retest entry
|
Wait for price to pull back to the broken level and hold, then enter
|
Lower — best risk-to-reward, but the retest doesn't always come
|
Patient traders prioritizing setup quality
|
|
Pattern-based
|
Enter on resolution of a defined chart pattern (triangle, flag, H&S)
|
Variable — depends on pattern reliability and market context
|
Technical traders who specialize in pattern recognition
|
Aggressive entries catch more of the move but eat more false signals. Retest entries miss some breakouts entirely — fast moves don’t always pull back — but the ones they do catch carry tighter stops and better reward-to-risk ratios.
The clearest way to internalize the 5-point filter is to see it pass and fail side by side. Two representative scenarios:
| Element | ETH (real breakout) | SOL (fakeout) |
|---|---|---|
|
Setup
|
9-day range, $3,200–$3,400, contracting candles
|
Tag of resistance after a quick rally
|
|
Session
|
Tuesday, EU/US overlap
|
Saturday, 2 AM UTC
|
|
Breakout candle
|
4h close at $3,485 (decisive body)
|
Wick pierces by 1.2%, body closes back inside range
|
|
Volume
|
80% above 20-period average
|
Roughly equal to average
|
|
Filters passed
|
All 5 |
2 of 5
|
|
Outcome |
Pulls back to $3,410, holds, resumes higher
|
Back inside the range within 4 hours
|
A confirmation-close trader takes the ETH setup near $3,485 with a stop at $3,360 (3.6% risk); a retest trader enters at $3,410 with a tighter stop near $3,340. Both scale out at the first 1:2 target. The SOL setup, failing three filters — thin session, wick rather than body, no volume expansion — is never taken at all. The difference between the two outcomes isn’t predictive skill. It’s the willingness to wait for setups that pass the filter.
Risk management is where breakout strategies live or die, and it’s the dimension that separates funded prop traders from blown-up accounts. Even a strategy with a 40% win rate can be highly profitable if winners run two or three times the size of losers.
The non-negotiables:
Prop trading firms watch drawdown more closely than win rate for a reason. A trader who survives the losing streaks gets to compound the winners.
There’s a quiet frustration that follows most retail breakout traders: the strategy works, the math checks out, but the account is too small to make the time worth it. Run the numbers — 1.5% risk, 1:2 reward, three or four qualifying setups a week — and the issue becomes concrete. On a $2,000 account, a winning trade nets roughly $60. The same setup on $100,000 in funded capital nets $3,000. Same strategy, size constraint removed.
Crypto Fund Trader is built around closing exactly that gap. Traders qualify through an evaluation that mirrors the discipline breakout strategies demand — defined risk per trade, hard drawdown limits, consistency over hero trades — and those who pass trade firm capital with profit splits up to 90%. The structure isn’t a shortcut; it rewards the same habits this article has been describing. For traders who’ve already proven the framework on their own charts, the bottleneck isn’t the setup. It’s the size behind it.
Even with a sound framework, the same execution errors trip up traders again and again:
Each is a violation of the 5-point filter dressed up as intuition.
A profitable crypto breakout strategy is less about prediction and more about process. Identify levels that matter, run setups through the 5-point filter, size positions so failure costs little, and let the asymmetric winners pay for the losers. The traders who do this consistently aren’t right more often — they’re disciplined more often.
Markets will keep printing breakouts every day, on every timeframe, across every coin. The opportunity isn’t going anywhere — but the traders who’ll capture the next major move are already building the framework today. The only question is whether the next time a chart breaks, you’re trading a plan, chasing a candle, or finally trading the size your edge deserves.
This article is for educational purposes only and does not constitute financial advice. Trading cryptocurrency carries substantial risk, including the potential loss of capital. Always conduct your own research and consider consulting a qualified financial professional before trading.
-
© 2026 - All Rights Reserved.
SWISS RLCRATES AG is a provider of educational services, all information available on our site is intended solely for the study purposes related to trading on financial markets. Accordingly, we do not offer financial, investment, tax, brokerage or other advice and/or services. Trading in financial markets is a high-risk activity, past performance do not guarantee future ones. It is highly advised not to risk more, than you can afford to lose. Brokers and operators of trading platforms are persons or entities that are separate from SWISS RLCRATES AG and their own terms and conditions will apply when you use their services and products. Neither SWISS RLCRATES AG nor RLCRATES, S.L. (as MT5 license holder) operate in countries where crypto or CFD’s activity is not allowed. The content in our platform is applicable to the extent local laws and/or regulations permit.