
Crypto Market Analysis. Osbrah’s September 23-27 Weekly Outlook
Welcome to our market review where we will delve into current market dynamics and prepare our plan for the day.
What are we watching today ?
What are we watching today ?
- Assets to Watch: Today we’ll closely take a look at Bitcoin, Ethereum, Total 3 & SPX.
- Key Levels: Identifying and analyzing key levels that are crucial for these assets.
- Today’s Economic News and Events: Bringing you the latest updates and economic events of the day that could impact the market and influence your trading.
Bitcoin
Bitcoin has experienced a significant price appreciation since the U.S. Federal Reserve reduced interest rates by 0.50 basis points on September 18. This monetary decision has stimulated financial markets, allowing Bitcoin to break through the psychological barrier of $60,000 and reach the critical resistance level at $65,000. This progression highlights renewed investor confidence in digital assets.
HTF Analysis
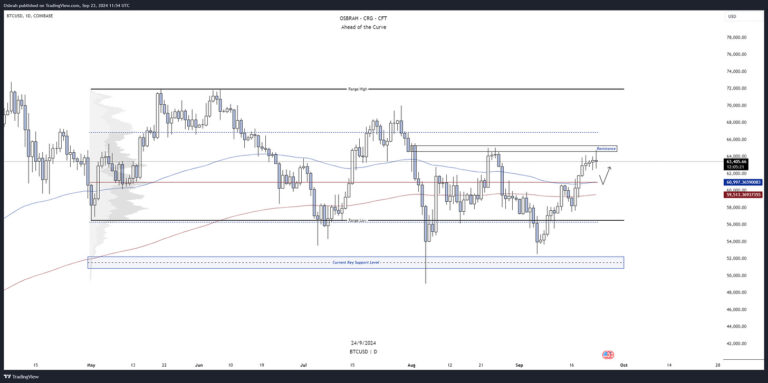
- The $65,000 level represents a major resistance, as mentioned in our previous analysis. This threshold has historically served as a barrier, and breaking it could signal a continuation of the bullish trend. If Bitcoin manages to surpass this level, the next target would be around $67,000, corresponding to the Value Area High, a key indicator for institutional traders.
- However, it is more probable that we will first witness a pullback to $61,000. This level is particularly significant as it corresponds to the Point of Control on the daily chart and the daily EMA100. A retreat to this zone would offer investors an opportunity to reposition before a potential new bullish impulse.
LTF Analysis
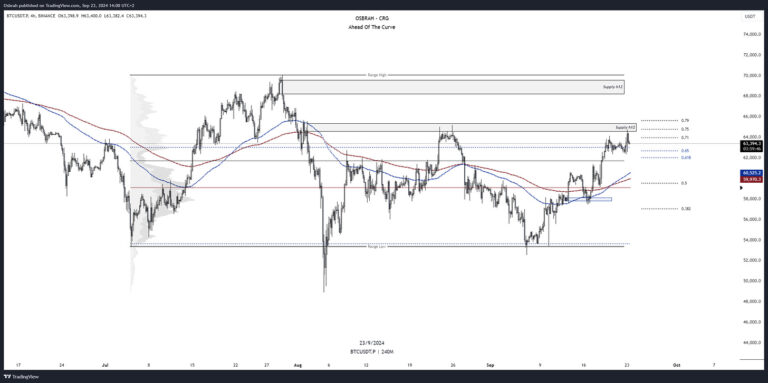
- On lower time frames, we observe a rejection near $65,000 due to the presence of a supply zone on the H12 chart and an Optimal Trade Entry based on Fibonacci retracements. This level also coincides with the starting point of the sell-off in early August, reinforcing its relevance as a strategic resistance.
- The immediate support is at $61,500, corresponding to the middle of the current range. A break of this support could lead the price toward $59,000, a critical level where the EMAs 100 and 200 are located. It is essential for this level to hold to avoid further deterioration of the market structure.
Liquidity Clusters
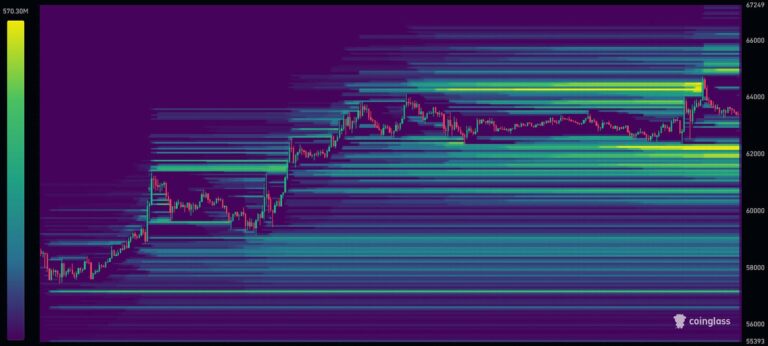
According to data provided by Coinglass, there is a concentration of liquidity below $62,000 to $63,000. This aligns with our technical analysis and suggests that these levels could be tested in case of increased selling pressure.
Traders should therefore monitor these zones closely to anticipate potential price movements.
Ethereum
Ethereum is showing signs of revival, particularly against the BTC pair, where it is regaining strength. On the ETH/USD pair, the asset has broken its downward trendline to the upside, indicating renewed interest from institutional and retail investors. This positive development could signal a resumption of the bullish trend for Ethereum.
HTF Analysis
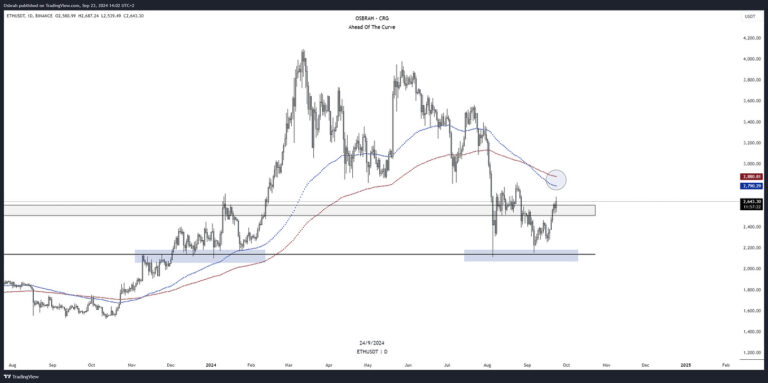
- The local bottom is currently around $2,100, serving as a major support. Since the formation of the “death cross,” the EMAs 100 and 200 have not been retested and are now positioned between $2,800 and $2,900, potentially acting as dynamic resistances.
- To maintain the current bullish momentum, the $2,500 level must hold. Consolidation above this threshold would reinforce market confidence and could attract new investment flows into Ethereum.
LTF Analysis
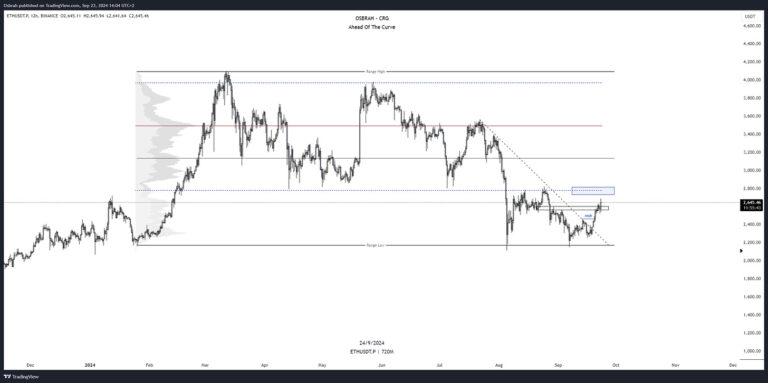
- On lower time frames, the break of the downward trendline is clearly visible, confirming a possible trend reversal. The $2,550 level is now a crucial support to preserve to consider a continuation of the bullish progression.
- If this support were to give way, a retest of lower levels, notably around the $2,150 support, would be probable. Conversely, if the bullish movement continues, the next major resistance is at $2,800, corresponding to the previous support and the former Value Area Low. This level will be decisive in assessing Ethereum’s ability to regain its positive momentum.
Altcoins
Altcoins have also benefited from the Fed’s rate cut, with some even outperforming ETH and BTC. This renewed interest in alternative assets offers notable investment opportunities, particularly in solid projects demonstrating resilience and consistent growth.
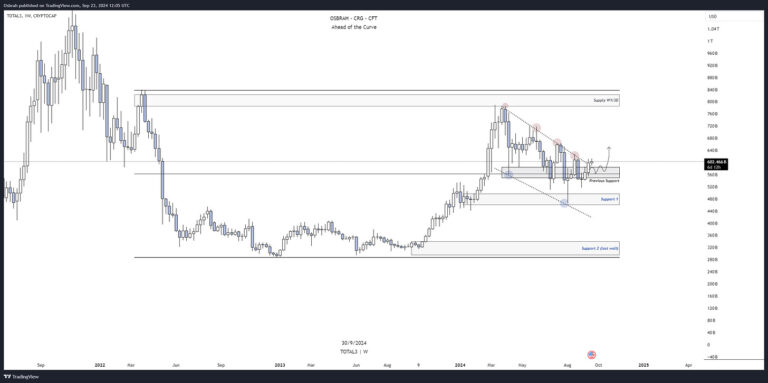
- The chart we have been observing for several weeks is becoming increasingly interesting. We are witnessing a break of the bearish channel to the upside, accompanied by a successful retest, which is generally interpreted as a strong bullish signal. A confirmation with a daily close of this break could indicate a continuation of the rise toward higher targets.
- However, re-entering the bearish channel would suggest that it was a false signal , prompting investors to reposition at lower levels. The key levels to watch are:
- Support at $600 billion in market capitalization, which must be maintained to support the bullish scenario. Bullish target then is $800 billion, representing a significant increase in the altcoin market.
- Bearish scenario: In case of a pullback, a rebound could be envisaged around $500 billion, or slightly below, potentially offering long-term buying opportunities.
SPX
The traditional stock market is displaying positive momentum, with the S&P 500 leading the way, propelled by the interest rate cut and encouraging employment figures. These macroeconomic factors have strengthened investor confidence, fueling a bullish trend in equity markets.
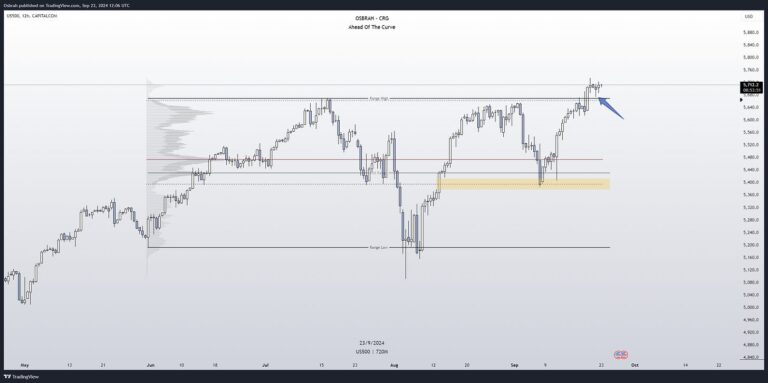
- The SPX has broken through the top of its range at 5,670 points and performed a successful retest of this level before rebounding, which is a bullish technical sign. As long as the index maintains above this previous range high, the trend remains favorable, and it is prudent to follow this direction.
- The level of 5,670 points thus becomes a key support for buying opportunities. Investors should, however, remain vigilant regarding upcoming economic data this week, which could influence the market’s direction.
Economic Events
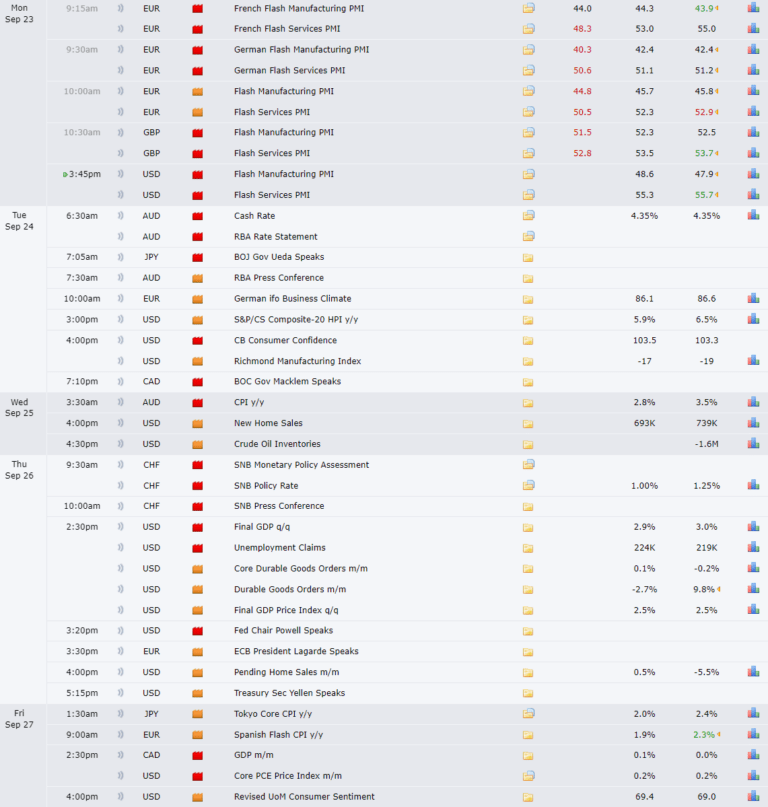
This week will be marked by several major economic releases that could increase volatility in financial markets:
- U.S. GDP Data: These figures will have a significant impact on the perception of the country’s economic health and could influence international investors’ decisions.
- Unemployment Figures (Thursday): Following recent Fed announcements, the labor market is under close scrutiny. Better or worse than expected results could provoke abrupt market movements.
- Jerome Powell’s Speech (Thursday): The Fed Chairman will speak, and his comments will be closely analyzed for any indications regarding future monetary policy. His statements could have an immediate impact on the trend of financial markets.
Given these events, it is recommended that investors and traders exercise caution and closely monitor key indicators while adjusting their strategies according to market developments.
That’s it for today!
From the CFT team we wish you a happy week and good trades. Remember that none of the above is financial advice and the sole purpose is to give you insights about the current market conditions.
Thanks for reading.
Written by Osbrah From CryptoRise Group.
X: Osbrah