
Crypto Market Analysis. Osbrah’s August 26-30 Weekly Outlook
Welcome to our market review where we will delve into current market dynamics and prepare our plan for the day.
What are we watching today ?
- Assets to Watch: Today we’ll closely take a look at Bitcoin, Ethereum, Total 3 & SPX.
- Key Levels: Identifying and analyzing key levels that are crucial for these assets.
- Today’s Economic News and Events: Bringing you the latest updates and economic events of the day that could impact the market and influence your trading.
Bitcoin
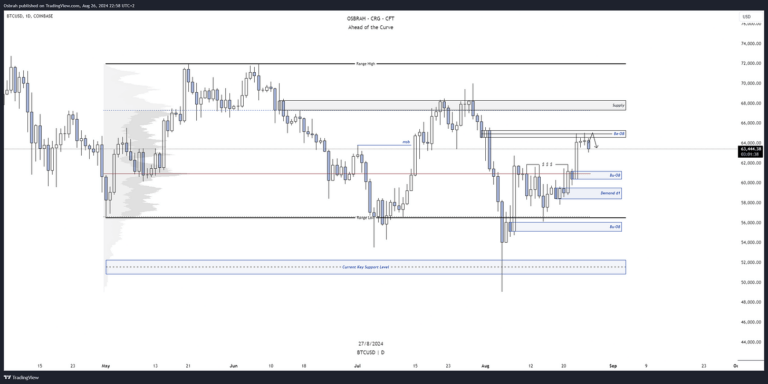
After a strong rally from the bottom at $56,700, Bitcoin didn’t just give us a profit-taking opportunity around $62,000; it decisively broke through the resistance and surged to $65,000. This is where things get interesting.
HTF Analysis
- The $62,000 level acted as a strong barrier, with a Point of Control (PoC) serving as a highly contested area, ultimately claimed by the bulls.
- The daily supply zone around $65,000 was clear, as it initiated the previous sell-off. Caution is advised here, but a decisive break could target $70,000.
- In the event of a pullback, we will look at the $62,000 level again, or even $61,000, considering the demand at that level.
LTF Analysis
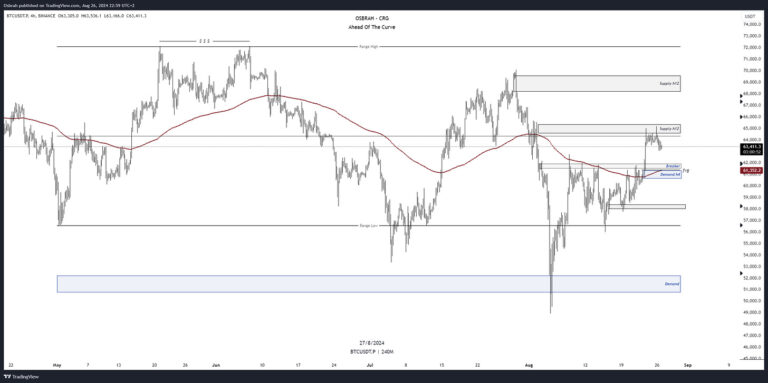
- The LTF chart allows us to refine our analysis. The $65,000 supply zone was also pronounced and straightforward for taking a short position.
- There’s significant imbalance, with an FVG to fill at $61,400.
- Our H4 EMA200 aligns with the FVG mentioned above, as it’s located at nearly the same level.
- This zone is interesting and extends up to $62,000, where we find our previous resistance. This could potentially flip to support (S/R flip) and act as a breaker.
- To summarize, $65,000 remains a major resistance level, making it ideal for shorting. Conversely, $62,000 should act as effective support, and this is where buying positions should be considered.
Liquidity Clusters
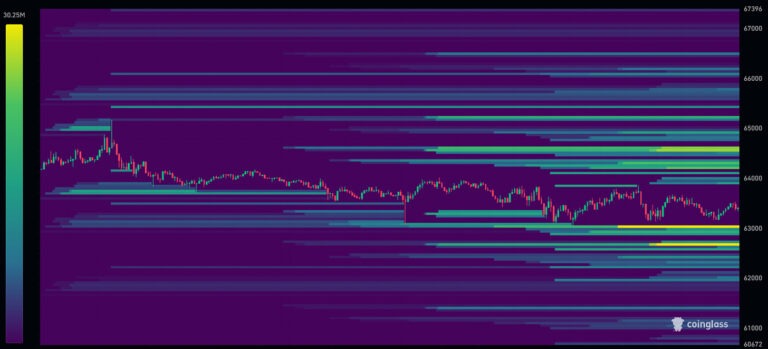
The alignment is perfect as the Coinglass map shows liquidity to the north beyond $64,500 and liquidity to the south below $62,500.
Ethereum
After struggling to keep up with Bitcoin’s performance, Ethereum is starting to lose ground again, showing less strength than many altcoins. The ETFs have not been able to close this gap.
Analysis
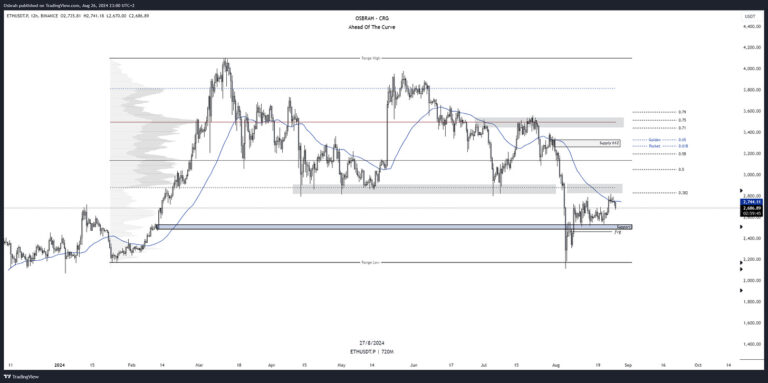
- Since our last weekly analysis, Ethereum has successfully reclaimed the $2,500 level, a key zone that it must now maintain to avoid revisiting lower levels.
- The resistance zone is located around the grey areas on the chart. Here, we have our previous VaL and the 0.382 Fibonacci level. This tough zone extends from $2,820 to $2,900. Until a clear break occurs, this is our sell zone.
- In case of a pullback, the interesting buy zone is between $2,500 and $2,460, where we left a demand zone and an FVG to fill.
ETHBTC
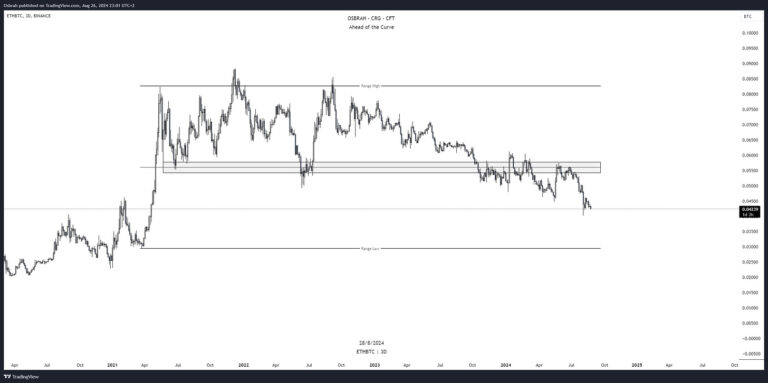
There’s little to add; the chart speaks for itself. We have lost a major level within this 3-day range, with the obvious target now being the lower boundary of the range, around 0.030.
TOTAL 3
Regarding altcoins, nothing has significantly changed on the chart. However, a well-established bearish channel has formed, and it’s wise to highlight it on the chart.
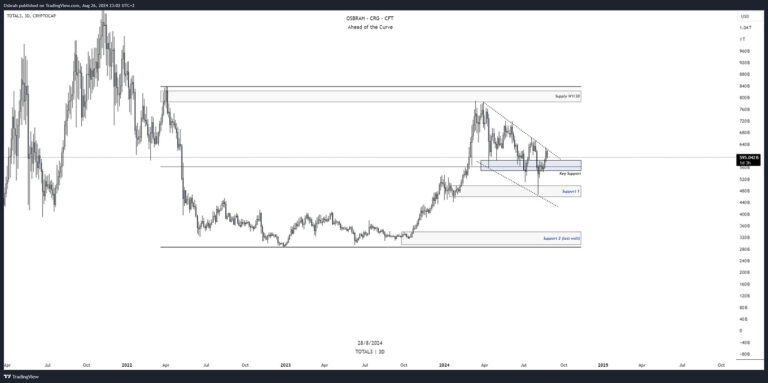
What we should now look for when positioning in the altcoin market:
- A decisive reclaim of support above the $575 – $600 billion market cap.
- A break of the bearish channel, followed by a confirmation retest.
- A rebound on the support at $475 billion, where we left a wick that could be filled.
Without these elements, caution remains the best strategy concerning altcoins, which are still relatively weak despite the strong performance of this past weekend.
SPX
A quick note on the SPX as well, which has rebounded from the bottom of its range to test the top, where it has so far front-run the upper boundary but has seen a significant rejection at that level.
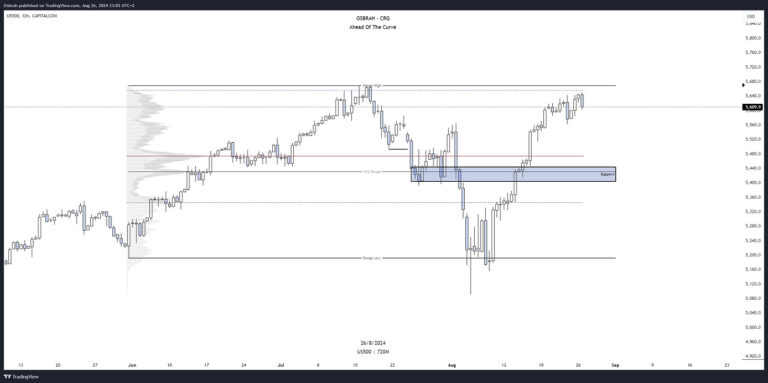
In my view, caution is warranted here, and the following zones should be monitored:
- For Buyers: The level around the PoC appears interesting as a potential pivot point, which lies between 5,475 and 5,430 points.
- For Sellers: The zone between 5,600 and 5,670 points should be appealing; this is where the top of the range and the VaH are located.
Cautious as we are approaching some key economic events with important figures being released.
Economic Events
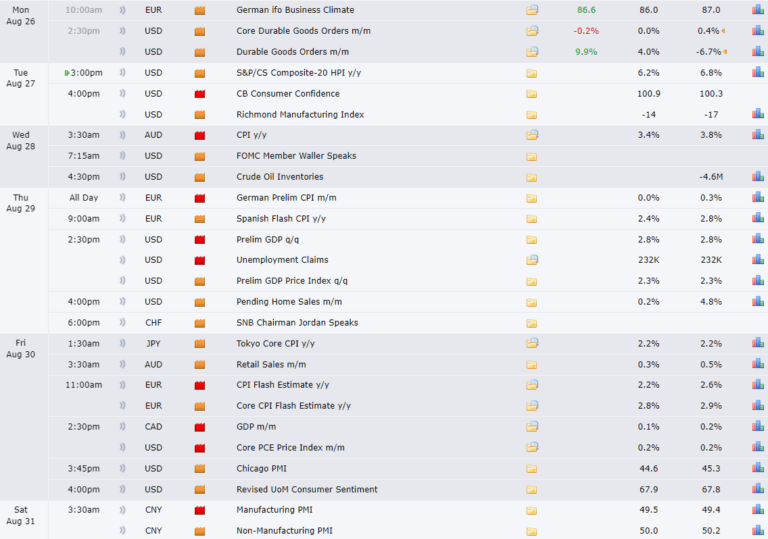
This week features the usual employment and US unemployment reports on Thursday. More importantly, the PCE report will set the tone for the coming days as we approach the next FED meeting, the FOMC, with a very probable interest rate cut on the horizon.
That’s it for today!
Thank you for reading this article. From the CFT team we wish you a happy week and good trades.
Remember that none of the above is financial advice and the sole purpose is to give you insights about the current market conditions.
Thanks for reading.
Written by Osbrah From CryptoRise Group.
X: Osbrah