
Crypto Market Analysis. November 04, 2024 Weekly Outlook.
Welcome to our market review where we will delve into current market dynamics and prepare our plan for the day.
What are we watching today ?
What are we watching today ?
- Assets to Watch: Today we’ll closely take a look at Bitcoin, Ethereum, Total 3 & SPX.
- Key Levels: Identifying and analyzing key levels that are crucial for these assets.
- Today’s Economic News and Events: Bringing you the latest updates and economic events of the day that could impact the market and influence your trading.
Bitcoin
HTF Analysis
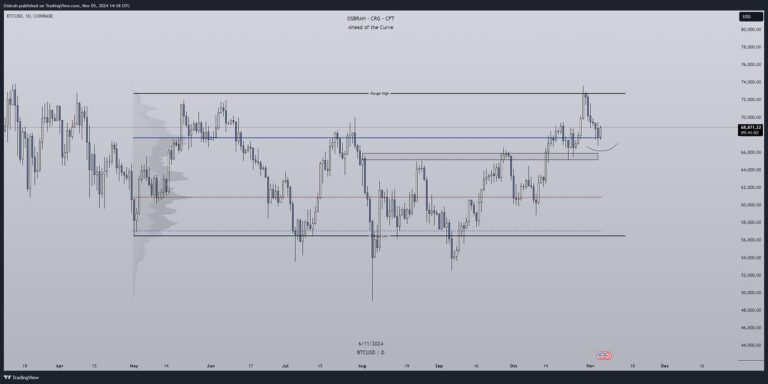
We observe that Bitcoin, on the daily chart, is maintaining its bullish trend.
- The recent rejection occurred at a logical price zone, slightly below the all-time high (ATH), at the upper boundary of the range.
- The current support is around $67,000, a previous key level and the point of control (POC) of the volume profile of the established range.
- In a bullish scenario, a liquidity hunt could lead us toward a new ATH.
- The bearish scenario would involve retesting lower support zones around $65,500.
LTF Analysis
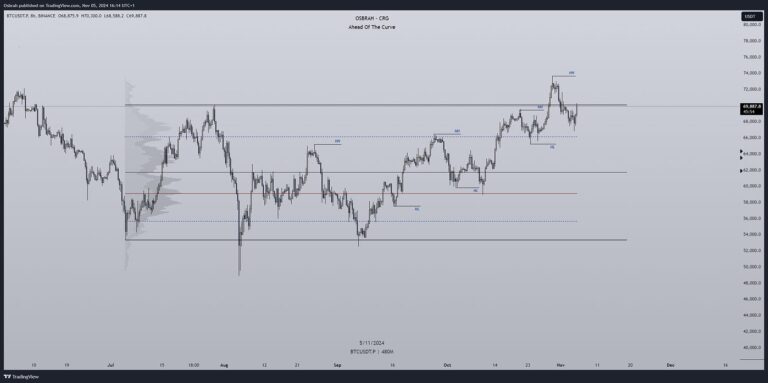
- On the 8-hour chart, there is also a well-defined range, with the lower boundary at $53,000 and the upper boundary at $70,000.
- The trend remains bullish, as evidenced by a series of higher highs and higher lows.
- Current support zones are at $66,000 and then $62,000 if the daily support at $67,000 fails.
- Resistance remains at $70,000, currently acting as a bearish retest after a clear deviation.
Liquidation Clusters
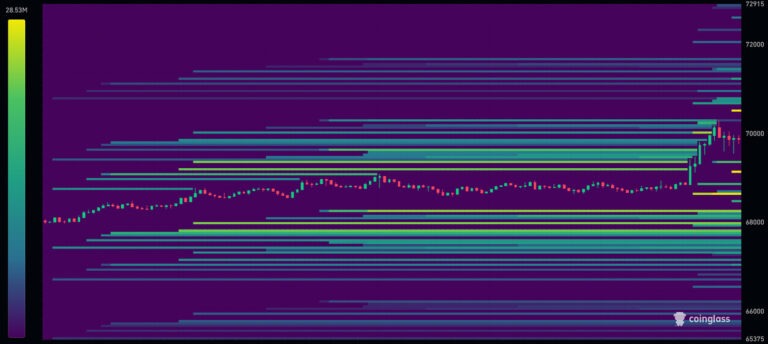
Most of the liquidity, according to Coinglass, has been taken to the upside with the recent move, from $66,800. We could have a pullback to rinse late longs and take the liquidity before a major move towards ATH next.
Ethereum
HTF Analysis
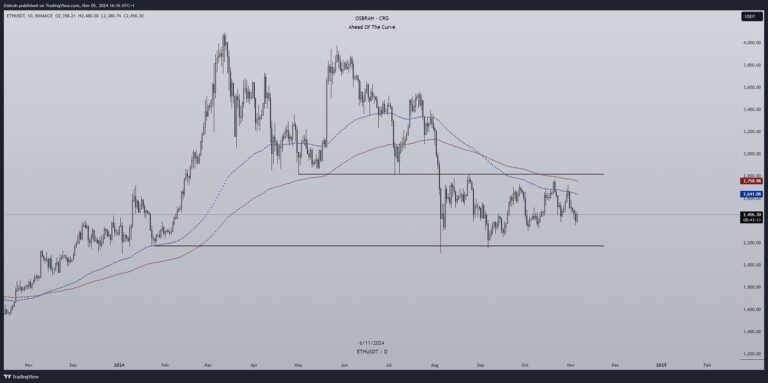
- Ethereum is relatively weak compared to Bitcoin and even against some altcoins like Solana. It may be prudent to exercise patience and focus on bullish positions in other assets for now.
- Ethereum remains confined within a daily range: the lower boundary (support) around $2,170 and the upper boundary (resistance) around $2,800.
- Interestingly, interest in Ethereum ETFs is very low or even nonexistent; Bitcoin is heavily favored.
LTF Analysis
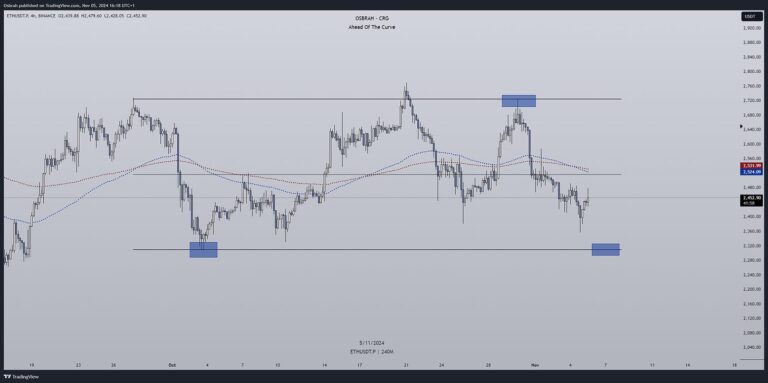
- On the 4-hour chart, we also observe a well-defined range: resistance and upper boundary around $2,725, and lower boundary and support around $2,300.
- The asset’s price remains below the 100 and 200 EMAs on the 4-hour chart, leaving little doubt about its weakness.
- In the event of a support breakdown, attention will shift to the higher time frame support mentioned above.
- In case of a resistance breakout, the next level will also correspond to the higher time frame price level previously mentioned.
ETH vs BTC
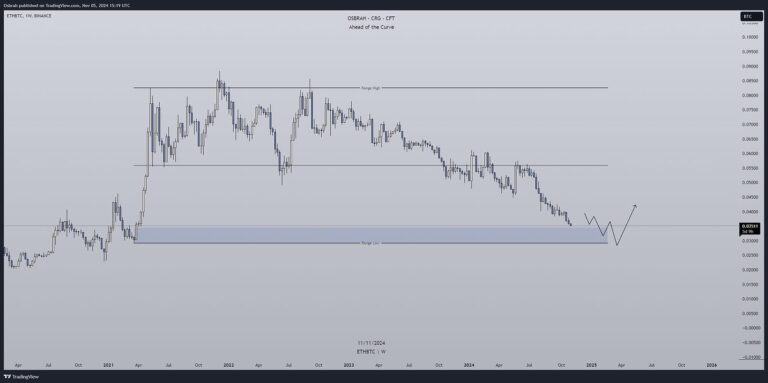
- The chart highlights Ethereum’s weakness and the strong preference for Bitcoin over the market’s second-largest cryptocurrency.
- The blue zone indicates where interest could shift more towards Ethereum, in conjunction with Bitcoin Dominance.
Altcoins (TOTAL 3)
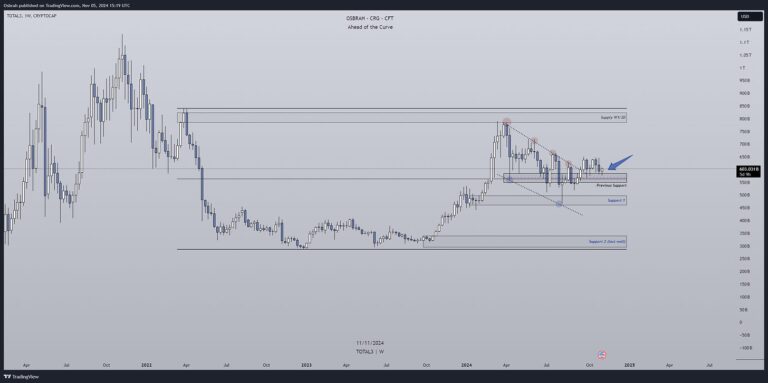
- Altcoins seem to be awaiting Bitcoin’s next directional move before determining their own path, which explains the volatility and the difficulty of leveraged trading in this market.
- The chart remains pertinent: support around $575 billion in market capitalization and resistance, still quite distant, around $800 billion.
- As long as the current level holds, it is reasonable to focus on altcoins that are relatively strong compared to Bitcoin and Ethereum, such as Solana, SUI, or Dogecoin.
- In case of a breakdown, it’s advisable not to be heavily exposed with leverage and to concentrate on a spot-based dollar-cost averaging (DCA) strategy.
S&P500
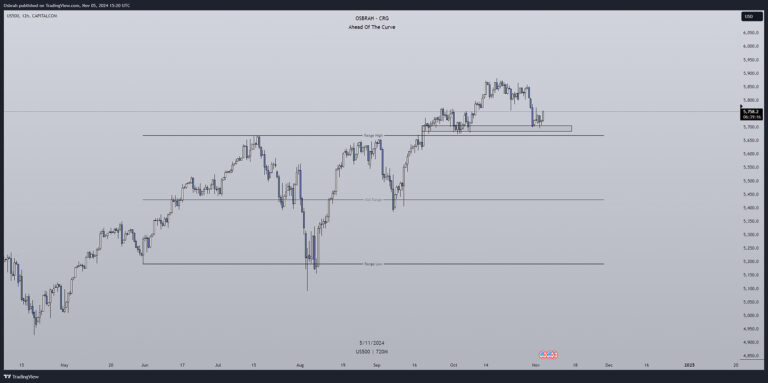
- Amid U.S. presidential elections, speculators have reduced their exposure to the S&P 500 (SPX) due to significant uncertainty. As a result, the otherwise robust index has declined to support levels just below 5,700 points.
- This level is particularly important as it represents the previous range high; it must hold to avoid re-entering the range and targeting much lower zones.
- The index is likely to be significantly impacted in the short term by the election results, so caution is advised in the coming days.
- In the event of a bullish impulse, resistances are expected around 5,780 and 5,800 points, previous supports that have been lost.
Economic Events
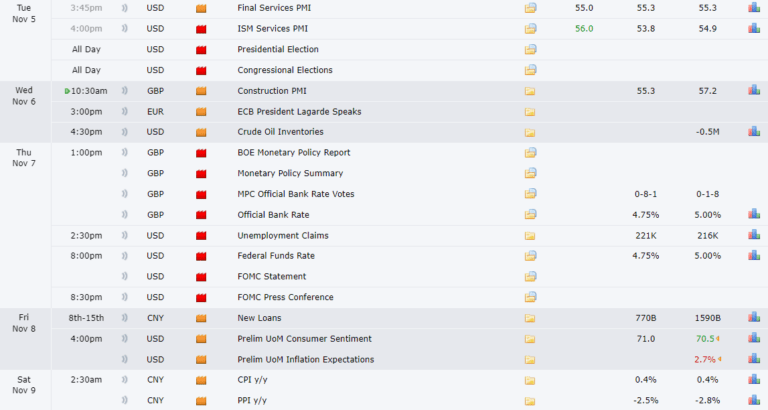
- As mentioned earlier, the U.S. elections are drawing attention and contributing to market uncertainty.
- Additionally, the upcoming FOMC meeting is scheduled for November 7, with market expectations of a 25 basis point rate cut to be announced by Jerome Powell just before his speech and Q&A session with journalists.
- Therefore, a heightened level of volatility is to be expected.
Please note: The U.S. presidential elections are scheduled for this week. Any upcoming FOMC meetings and expected rate decisions should be confirmed with official sources, as they may differ from current expectations. You may follow those at forexfactory.com
That’s it for today!
From the CFT team we wish you a happy week and good trades. Remember that none of the above is financial advice and the sole purpose is to give you insights about the current market conditions.
Thanks for reading.
Written by Osbrah From CryptoRise Group.
X: Osbrah