

Most traders add MACD to their chart, watch for the two lines to cross, and start clicking. Then the whipsaws begin: a cross up, a quick loss, a cross down, another loss, all while price chops sideways. The indicator is not broken. It is being read as a standalone trigger when it works far better as a momentum filter inside a defined plan.
This guide assumes you already know how to place a trade and read a basic chart. The focus here is narrow and practical: how to turn the macd crypto strategy into concrete signals you can act on, which ones to trust, which to skip, and exactly where entries, stops, and targets go. Three signal types do almost all the work, and each comes with a real example on Bitcoin.
A quick refresher, because reading the signals correctly depends on knowing what the lines represent.
MACD, the Moving Average Convergence Divergence, has three parts. The MACD line is the difference between the 12-period and 26-period exponential moving averages. The signal line is a 9-period EMA of the MACD line. The histogram is the gap between those two lines, drawn as bars.
In plain terms, MACD measures momentum: how fast price is moving and whether that pace is building or fading. When the MACD line pulls away from the signal line, momentum is strengthening. When they converge, momentum is stalling. The zero line matters too: above it, the shorter average is above the longer one and bulls have the upper hand; below it, bears do. Everything in a working macd indicator crypto approach comes from reading those three relationships in context.
The default 12, 26, 9 settings work well across most crypto timeframes. Shortening them makes the indicator faster and noisier; lengthening them smooths it and lags more. Most traders leave the defaults and adjust the timeframe instead.
The crossover is the most common signal and the most abused. A bullish cross is the MACD line crossing above the signal line. A bearish cross is the MACD line dropping below it. On the histogram, the bars flip from negative to positive on a bullish cross.
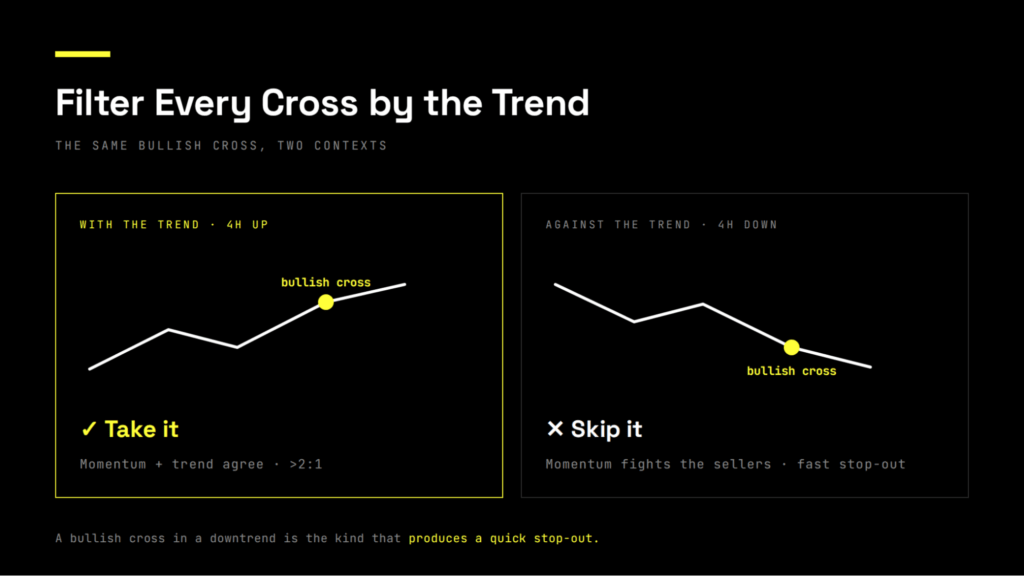
Traded blindly, crossovers whipsaw badly in ranging markets. The fix is to filter them by location and trend. A crossover means far more when it agrees with the higher-timeframe direction and happens at a sensible point, not in the middle of a chop.
A concrete example. Bitcoin is in a 4-hour uptrend, making higher lows. Price pulls back, and on the 1-hour chart the MACD line crosses above the signal line while both are still below or near the zero line, the typical location for a pullback entry in an uptrend.
The discipline is skipping the crossover that fights the trend. A bullish cross during a clear 4-hour downtrend is the kind of signal that produces a fast stop-out, because momentum is briefly turning inside a market still controlled by sellers.
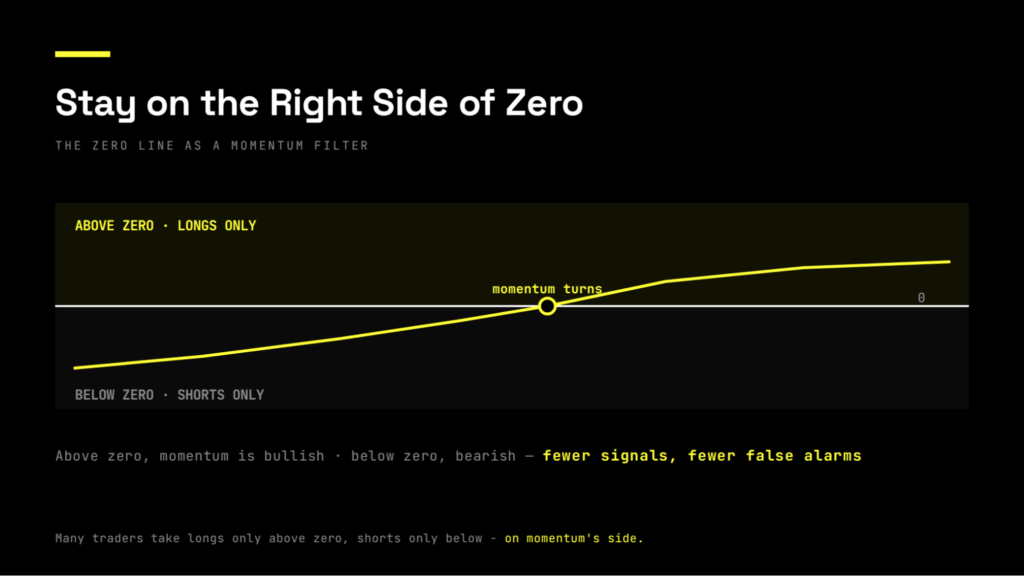
fewer signals but fewer false alarms, keeping you on the right side of momentum.
The zero-line cross is slower and more reliable than the signal-line crossover, and beginners overlook it. When the MACD line crosses above zero, short-term momentum has fully shifted bullish; below zero, bearish. It catches fewer tops and bottoms but produces fewer false alarms, which suits swing-style entries on the higher timeframes.
An example. On the 4-hour Bitcoin chart, price has been basing after a decline. The MACD line, which spent weeks below zero, finally pushes above the zero line as price reclaims a key level around $63,000.
The zero-line cross works as a trend filter as much as an entry. Many traders only take long signals while MACD is above zero and short signals while it is below, using the line to keep them on the right side of momentum.
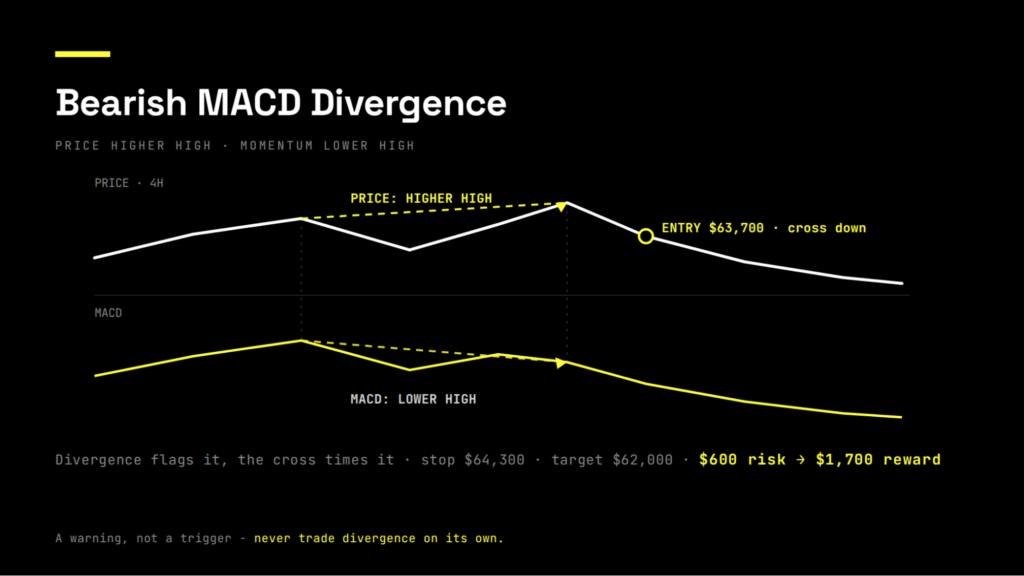
Divergence is the most powerful MACD signal and the most underused. It occurs when price and the MACD disagree, hinting that the move is running out of fuel before price actually turns.
Bearish divergence: price makes a higher high, but MACD makes a lower high. Buyers pushed price to a new peak, yet momentum behind that push weakened. It warns a rally may be exhausting.
Bullish divergence: price makes a lower low, but MACD makes a higher low. Sellers drove a new low, but with less force, hinting that selling pressure is fading.
A concrete example. Bitcoin grinds up to a higher high at $64,000, but the MACD histogram and line print a noticeably lower high than they did at the previous peak near $63,500. Momentum is fading even as price climbs.
The critical caveat: in strong trends, especially parabolic crypto moves, divergence can print several times while price keeps running. Never trade divergence on its own. Treat it as a heads-up that demands a second signal before you act.
MACD is a filter, not an oracle. Its signals improve sharply when read alongside price structure rather than in isolation.
The highest-quality setups stack conditions. A bullish MACD crossover that also occurs at a tested support level, in a higher-timeframe uptrend, on rising volume, is worth far more than a crossover floating in the middle of a range. Each agreeing element raises the odds. When MACD says one thing and price structure says another, the trade deserves more scrutiny or no entry at all.
A common pairing is MACD with the 50 or 200-period moving average. A bullish MACD signal while price holds above its 200-MA carries more weight, because momentum and trend agree. Using MACD for the momentum read and a moving average for the trend backdrop is cleaner than leaning on either alone.
| Signal | What It Shows | Best Filter |
|---|---|---|
|
Signal-line crossover
|
Short-term momentum shift
|
Higher-timeframe trend direction
|
|
Zero-line cross
|
Full momentum regime change
|
Price reclaiming or losing a key level
|
|
Divergence
|
Momentum fading vs price
|
A confirming crossover or structure break
|
No indicator is complete, and knowing MACD’s failure modes prevents expensive mistakes.
It lags, by design. MACD is built from moving averages, so it confirms moves rather than predicting them. By the time a signal is clean, part of the move is often done.
It whipsaws in ranges. During sideways chop, crossovers fire constantly and most are noise. Many traders simply stand aside when price is ranging and MACD is hugging the zero line.
It stays extended in strong trends. In a powerful rally, MACD can remain stretched and print repeated divergences while price keeps climbing. Fading a strong trend on MACD alone is how traders get run over.
The corrective for all three is the same: treat every MACD signal as a hypothesis that needs confirmation from price structure, volume, or the trend before it becomes a trade.
Even the best MACD read fails without sizing and stops, because one oversized loss erases a string of good signals.
Risk a small fixed fraction of the account per trade, often 1 percent, and size the position from the stop distance rather than the leverage available. In the crossover example, with a $400 stop distance and $50 of risk allowed on a $5,000 account, the position size is $50 divided by $400, about 0.125 BTC of exposure. The MACD signal finds the trade; the math keeps the loss survivable.
Place the stop where the signal would be proven wrong, not at an arbitrary distance. For a crossover entry that is below the swing low; for a zero-line entry, below the structure that justified it. And set a daily loss limit so two bad MACD trades in a chop do not turn into a revenge-trading spiral.
Traders who build a reliable MACD process often hit the same ceiling: the signals work, but the account is too small for the returns to matter. This is where crypto proprietary trading firms come in.
A prop firm provides its capital after an evaluation, then enforces strict limits, typically a daily loss cap near 5 percent and a maximum drawdown near 10 percent. A trader running a disciplined macd crypto strategy with fixed risk and logical stops tends to fit that structure well, because the firm’s rules demand the same control the strategy already uses. The firm shares the profit, and the downside of failing is the evaluation fee rather than personal savings.
Crypto Fund Trader is one example in the crypto-native space. It has operated since November 2022 under a Swiss-registered company, offers funded accounts with leverage up to 1:100, and routes part of its evaluation through a Bybit integration so orders execute on real exchange infrastructure. For a systematic trader, the firm’s limits reinforce the discipline a rules-based MACD approach already relies on.
The MACD indicator earns its place on a chart not as a buy-and-sell switch but as a momentum filter that, read in context, sharpens timing and flags fading trends before price confirms them. The three signals here, the trend-aligned crossover, the slower zero-line cross, and divergence backed by confirmation, cover most of what a trader needs.
The traders who get value from a macd indicator crypto setup are not using it differently from everyone else. They are using it with something else: price structure, a trend filter, and strict risk control. The indicator is one voice in the decision, never the only one, and that distinction is the difference between whipsaw losses and clean, repeatable entries.
What is the best MACD crypto strategy for beginners?
The trend-aligned crossover is the most approachable, taking bullish crosses only in a higher-timeframe uptrend and bearish crosses only in a downtrend. A sound macd crypto strategy depends far more on filtering signals by trend than on the crossover itself.
What are the best MACD settings for crypto?
The default 12, 26, 9 settings work well across most crypto timeframes, so most traders leave them and change the chart timeframe instead. Shorter settings react faster but produce more false signals, while longer ones lag more.
Does the MACD indicator work for crypto given how volatile it is?
Yes, the macd indicator crypto traders use reads momentum well in trending conditions, but it whipsaws badly during sideways chop. The fix is to skip signals when price is ranging and MACD is hugging the zero line.
Should I trade MACD crossovers on their own?
No, crossovers traded in isolation whipsaw frequently, especially in ranges. They become reliable only when filtered by the higher-timeframe trend and ideally confirmed by a key price level or volume.
What is MACD divergence and is it reliable?
Divergence is when price and MACD disagree, such as price making a higher high while MACD makes a lower high, hinting that momentum is fading. It is a strong warning but unreliable alone, since strong trends can print several divergences before price turns, so it needs a confirming signal.
Which timeframe is best for MACD signals in crypto?
Higher timeframes like the 1-hour and 4-hour produce cleaner, more reliable MACD signals with fewer false triggers than the 5 or 15-minute charts. Many traders use a higher timeframe for the trend filter and a lower one to time the entry.
This article is for informational and educational purposes only and does not constitute financial advice. Trading cryptocurrencies and prop firm challenges involve significant risk; trade only with capital you can afford to lose.
-
© 2026 - All Rights Reserved.
SWISS RLCRATES AG is a provider of educational services, all information available on our site is intended solely for the study purposes related to trading on financial markets. Accordingly, we do not offer financial, investment, tax, brokerage or other advice and/or services. Trading in financial markets is a high-risk activity, past performance do not guarantee future ones. It is highly advised not to risk more, than you can afford to lose. Brokers and operators of trading platforms are persons or entities that are separate from SWISS RLCRATES AG and their own terms and conditions will apply when you use their services and products. Neither SWISS RLCRATES AG nor RLCRATES, S.L. (as MT5 license holder) operate in countries where crypto or CFD’s activity is not allowed. The content in our platform is applicable to the extent local laws and/or regulations permit.